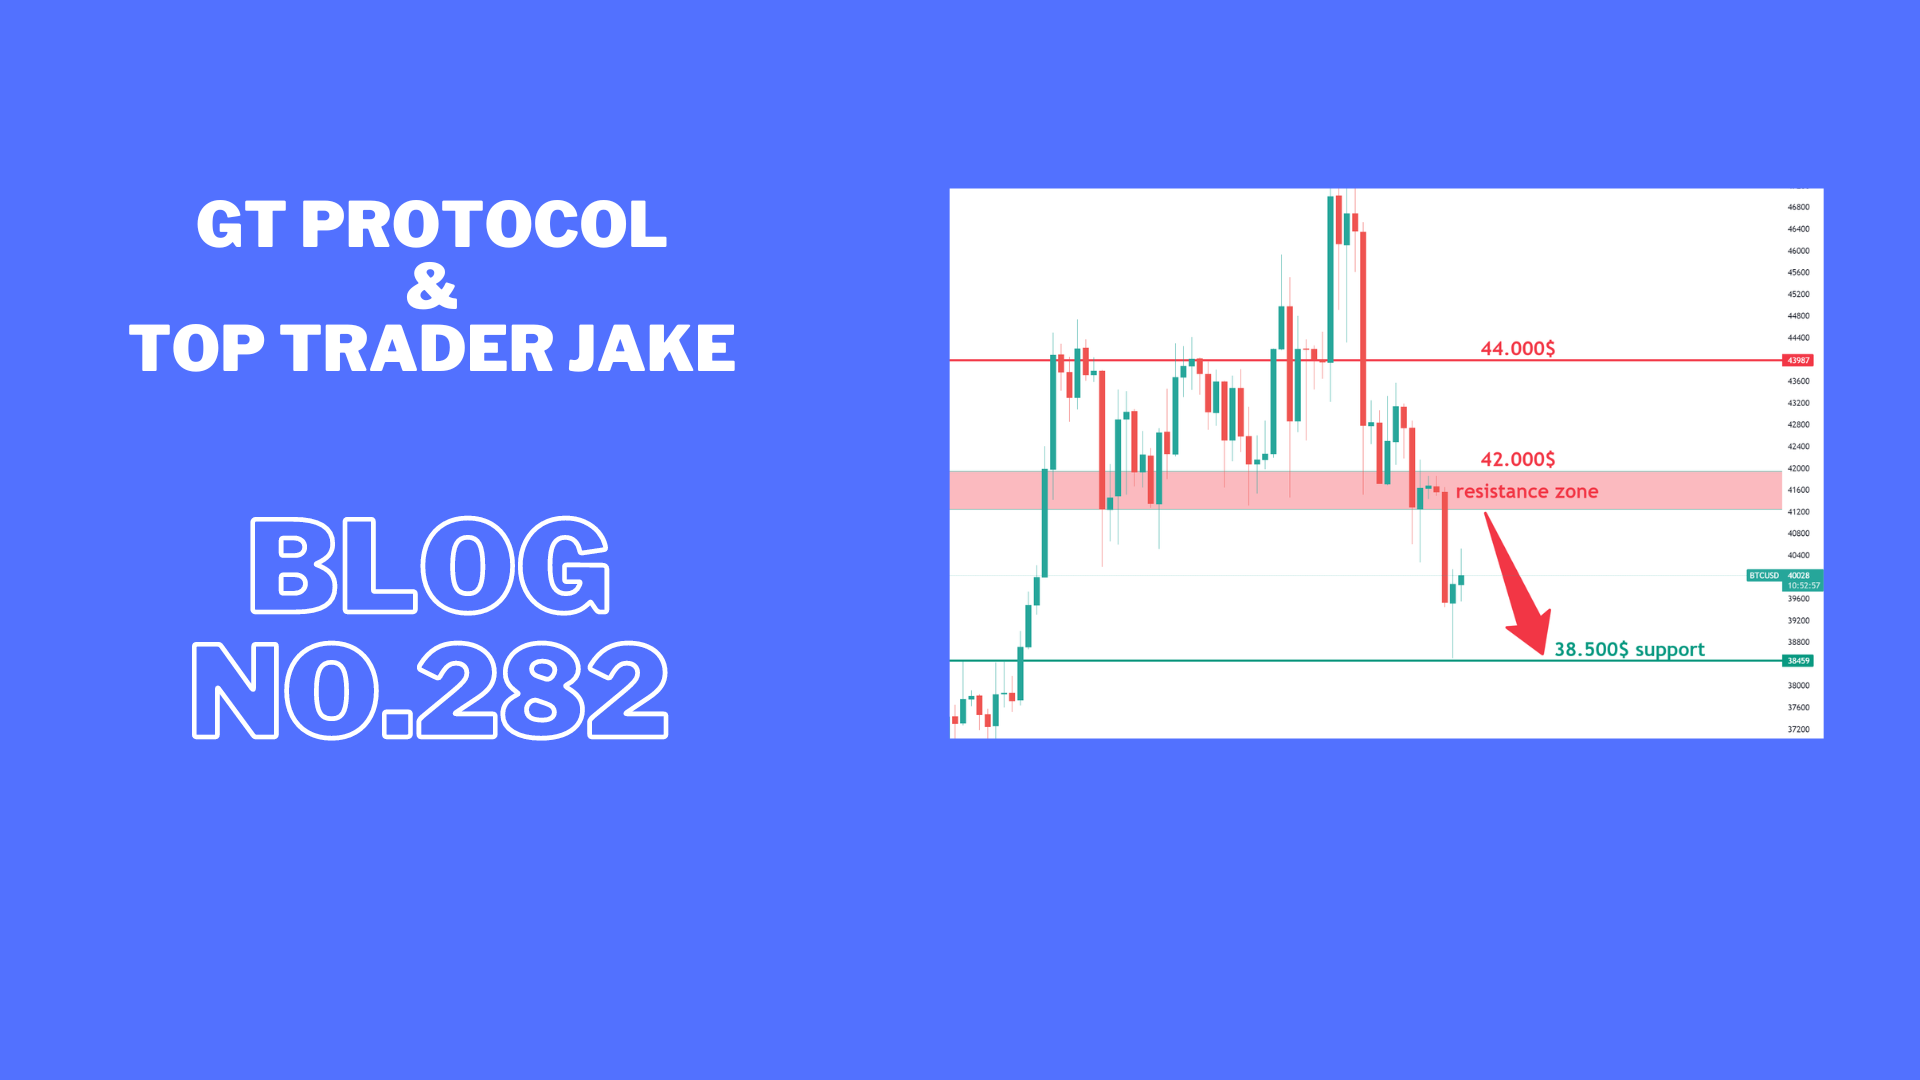


BTC could retest 42k resistance to clear late shorts.
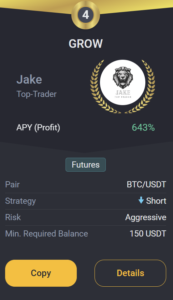
Jake
TOP Trader
BTC:
INTRO: BTC pushing into 42k$ resistance.
Technical analysis for the BTC/USDT chart:
Key Levels:
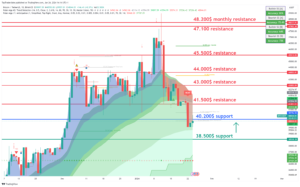
- Resistance: $41,500, $43,000
- Support: $38,500, $40,200
Strategy:
- Long: Buy at $38,500 with a stop loss below $37,000 and a target price of $41,000.
- Short: Sell at $41,500 with a stop loss above $42,500 and a target price of $40,200.
Range Description:
BTC/USDT is currently trading between $38,500 and $42,000. The pair has broken into the range during the day. However, there are signs that the pair is ready to make a move with a possible retest of support.
On the upside, BTC/USDT is facing resistance at $41,500. The $41,500 level has been tested today, and if the price holds above the daily close, it will be confirmed as support. A break above $41,500 would signal a bullish breakout and could send the pair higher to $43,000.
On the downside, BTC/USDT is facing support at $40,200. This level is a previous resistance for the day and now holds as support. A break below $40,200 would signal a bearish breakdown, sending the pair lower to $38,000 or even $37,000.
BTC1D chart TW link: https://www.tradingview.com/x/TltkEkhQ/
ETH:
INTRO: ETH testing support at 2200$.
Here is a technical analysis of the ETH/USDT chart:
Key Levels:
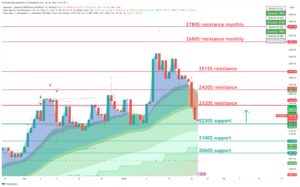
- Resistance: $2320, $2420
- Support: $2220, $2100
Strategy:
- Long: Buy at $2220 with a stop loss below $2100 and a target price of $2320.
- Short: Sell at $2320 with a stop loss above $2420 and a target price of $2200.
Range Description:
ETH/USDT is currently trading between $2200 and $2500. The pair has broken into the range during the day. However, there are signs that the pair is ready to make a move with a possible retest of support.
On the upside, ETH/USDT is facing resistance at $2320. This level hasn’t been tested today, and if the price holds above the daily close, it will be confirmed as support. A break above $2320 would signal a bullish breakout and could send the pair higher to $2420.
On the downside, ETH/USDT is facing support at $2220. This level is a previous swing low and has been tested multiple times in recent weeks as resistance. A break below $2220 would signal a bearish breakdown and could send the pair lower to $2120 or even $2000.
ETH1D chart TW link: https://www.tradingview.com/x/Qofn7ba4/
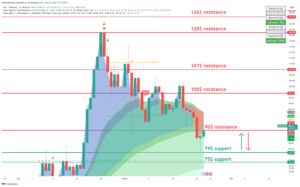
XRP:
INTRO: XRP holding above 0.5$ and needs to hold before the big nuke.
Here is a technical analysis of the XRP/USDT chart:
Key Levels:
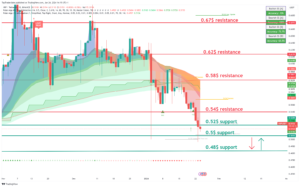
- Resistance: $0.54, $0.58
- Support: $0.5, $0.52
Strategy:
- Long: Buy at $0.5 with a stop loss below $0.48 and a target price of $0.58.
- Short: Sell at $0.54 with a stop loss above $0.58 and a target price of $0.5.
Range Description:
XRP/USDT is currently trading between $0.5 and $0.54. The pair has shifted into the range during the day. However, there are signs that the pair is ready to make a move with a possible retest of support.
On the upside, XRP/USDT is facing resistance at $0.54. This level has been tested today, and if the price holds above the daily close, it will be confirmed as support. A break above $0.54 would signal a bullish breakout and could send the pair higher to $0.58.
On the downside, XRP/USDT is facing support at $0.5. This level is a previous swing low and has been tested multiple times in recent weeks as significant support. A break below $0.5 would signal a bearish breakdown and could send the pair lower to $0.48 or even $0.46.
XRP chart TW link: https://www.tradingview.com/x/udOqqUxe/
LINK:
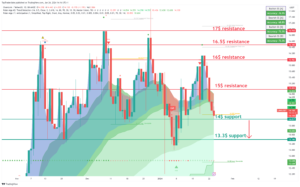
INTRO: LINK pushing high above 15$ resistance.
Here is a technical analysis for the LINK/USDT chart:
Key Levels:
- Resistance: $15, $16
- Support: $13.3, $14
Strategy:
- Long: Buy at $14 with a stop loss below $13 and a target price of $16.
- Short: Sell at $15 with a stop loss above $16.5 and a target price of $14.
Range Description:
LINK/USDT is currently trading between $14 and $16. The pair has shifted into the range during the day. However, there are signs that the pair is ready to make a move with a possible retest of support.