Altcoins are still slow in push up waiting for BTC to break up.
Jake
TOP Trader
BTC:
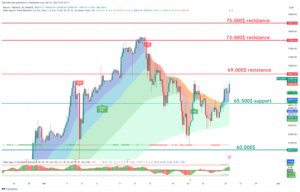
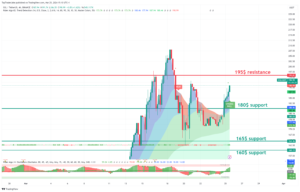
INTRO: BTC retesting 69.000$ as resistance.
Technical analysis for the BTC/USDT chart:
Key Levels:
- Resistance: $68.000, $69.500
- Support: $62,000, $63,000
Strategy:
- Long: Buy at $60,100 with a stop loss below $58,000 and a target price of $69,000.
- Short: Sell at $65,000 with a stop loss above $67,500 and a target price of $60,000.
Range Description:
BTC/USDT is currently trading in a range between $60,000 and $65,000. The pair has broken into range during the day. However, there are signs that the pair is ready to make a move with possible retest of support.
On the upside, BTC/USDT is facing resistance at $63,000. And 63,000$ level has been tested today, and if the price holds above on the daily close, it will be confirmed as support. A break above $63,000 would signal a bullish breakout and could send the pair higher to $65,000.
On the downside, BTC/USDT is facing support at $62,500. This level is a previous resistance for the day and now holds as support. A break below $62,500 would signal a bearish breakdown and could send the pair lower to $58,000 or even $50,000.
BTC1D chart TW: https://www.tradingview.com/x/VS0Z9pC4/
ETH:
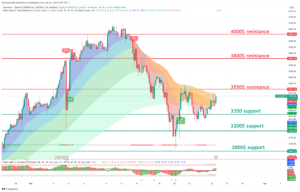
INTRO: ETH retesting 3550$ resistance.
Here is a technical analysis of the ETH/USDT chart:
Key Levels:
- Resistance: $3800, $3550
- Support: $3200, $3350
Strategy:
- Long: Buy at $3200 with a stop loss below $3000 and a target price of $4000.
- Short: Sell at $3600 with a stop loss above $3700 and a target price of $3000.
Range Description:
ETH/USDT is currently trading in a range between $3300 and $3600. The pair has broken into range during the day. However, there are signs that the pair is ready to make a move with possible retest of support.
On the upside, ETH/USDT is facing resistance at $3500. This level hasn’t been tested today, and if the price holds above it at the daily close, it will be confirmed as support. A break above $3500 would signal a bullish breakout and could send the pair higher to $3700.
On the downside, ETH/USDT is facing support at $3300. This level is a previous swing low and has been tested multiple times in recent weeks as resistance. A break below $3300 would signal a bearish breakdown and could send the pair lower to $3000 or even $2800.
ETH1D chart TW link: https://www.tradingview.com/x/HKNdiuzC/
XRP:
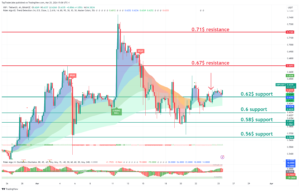
INTRO: XRP retesting 0.62$ support.
Here is a technical analysis of the XRP/USDT chart:
Key Levels:
- Resistance: $0.70, $0.67
- Support: $0.62, $0.64
Strategy:
- Long: Buy at $0.67 with a stop loss below $0.62 and a target price of $0.78.
- Short: Sell at $0.72 with a stop loss above $0.74 and a target price of $0.62.
Range Description:
XRP/USDT is currently trading in a range between $0.62 and $0.72. The pair has shifted into range during the day. However, there are signs that the pair is ready to make a move with possible retest of support.
On the upside, XRP/USDT is facing resistance at $0.70. This level has been tested today, and if the price holds above on the daily close, it will be confirmed as support. A break above $0.70 would signal a bullish breakout and could send the pair higher to $0.72.
On the downside, XRP/USDT is facing support at $0.67. This level is a previous swing low and has been tested multiple times in recent weeks as big support. A break below $0.67 would signal a bearish breakdown and could send the pair lower to $0.62 or even $0.60.
XRP chart TW link: https://www.tradingview.com/x/kmRVDt3T/
LINK:
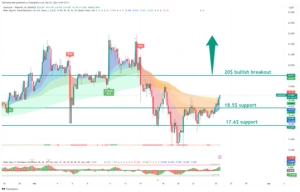
INTRO: LINK retest support at 17.5$.
Here is a technical analysis for the LINK/USDT chart:
Key Levels:
- Resistance: $20
- Support: $17.6
Strategy:
- Long: Buy at $17.6 with a stop loss below $17 and a target price of $20.
- Short: Sell at $20 with a stop loss above $21 and a target price of $17.6.
Range Description:
LINK/USDT is currently trading in a range between $17 and $20. The pair has shifting into range during day. However, there are signs that the pair is ready to make a move with possible retest of support.
On the upside, LINK/USDT is facing resistance at $20. This level has been tested today, and if price holds above it at the daily close, it will be confirmed as support. A break above $20 would signal a bullish breakout and could send the pair higher to $22.
On the downside, LINK/USDT is facing support at $17.6. This level is a previous swing low and has been tested multiple times in recent weeks as big resistance. A break below $17.6 would signal a bearish breakdown and could send the pair lower to $17 or even $16.
LINK chart TW link: https://www.tradingview.com/x/1sF2QA0R/
SOL:
INTRO: SOL retest 190$ resistance.
Here is a technical analysis for the SOL/USDT chart:
Key Levels:
- Resistance: $135, $126
- Support: $120, 107$
Strategy:
- Long: Buy at $120 with a stop loss below $100 and a target price of $130.
- Short: Sell at $100 with a stop loss above $107 and a target price of $90.
Range Description:
SOL/USDT is currently trading in a range between 120$ and 140$. However, there are signs that the pair is ready to make a move to push strong resistance at 150$.
On the upside, SOL/USDT is facing resistance at $135. This level it has been tested today, and if the price holds above on daily close it will be confirmed as support. A break above $135 would signal a bullish breakout and could send the pair higher to $150.
On the downside, SOL/USDT is facing support at $120. This level is a previous swing low and has been tested multiple times in recent weeks as big support. A break below $120 would signal a bearish breakdown and could send the pair lower to $100 or even $90.
SOL chart TW link: https://www.tradingview.com/x/4WT2Y8SS/
CRYPTO NEWS:
Venture funding is making a comeback…
Don’t call it a comeback, but VC investments into crypto companies have increased each month this year…
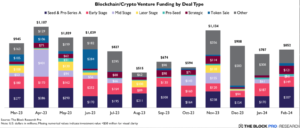
Here are some of the companies who secured the bag (?) this week…
Keyring raised $6M to help institutional investors interact with DeFi platforms in a compliant way. The crypto compliance platform uses zero-knowledge (ZK) proof technology to protect sensitive data and user privacy.
Ooga Booga raised $1M to build a decentralized exchange aggregator on Berachain. The goal is to find the cheapest crypto swaps for traders by scouring through different exchanges.
Succinct raised $43M to make cryptography easier. Not the heroes we deserve but the heroes we need.
MANTRA Chain raised $11M to develop a blockchain tailored to real-world assets (RWA’s). It will be used to swap tokenized real estate and other assets and is close to securing regulatory approval in the Middle East.
Tensorplex Labs raised $3M to build infrastructure for decentralized AI networks. The funding round included big names like Quantstamp and Amber Group.
FAST NEWS:
The Avalanche Foundation is launching a new incentive program to boost memecoins on the Avalanche blockchain. It’s called ‘Meme Coin Rush’ and will hand out rewards to users who provide liquidity for memecoin trading pools on certain DeFi platforms.
JPMorgan says BTC remains in ‘overbought territory’ despite the recent correction. JPMorgan analysts argue that two metrics — JPMorgan’s futures position proxies and the bitcoin futures price premium over the spot — suggest bitcoin is still overbought.
OKX is exiting India. The crypto exchange has asked users to withdraw funds by Apr. 30, 2024.
Ark Invest sold $52M worth of COIN shares. Ark’s investment strategy doesn’t let any individual holding take up more than 10% of an ETF’s portfolio – meaning it’s likely to continue rebalancing if COIN’s price keeps rising.
Bernstein is predicting BTC could hit $90,000 by the end of the year. This is up from its initial prediction of $80,000 a few weeks ago.
Final words:
When BTC makes a clear push above 69k, we could see a bigger push-up.
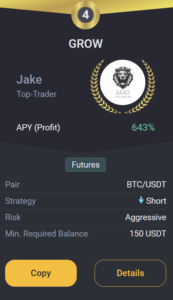
GROW BOT UPDATE:
Copy trade GROW 0.1->10k$ since 18.03.23 we got +219.0% PROFIT!
GROW CURRENTLY:
TRADING COIN: BTC/USDT
SETUP: SHORT
TAKE PROFIT: /
SAFETY ORDERS: /
Liquidation: /
Not Financial Advice!
Good luck with trades,
JAKE