Altcoins are still dropping from resistance.
Jake
TOP Trader
BTC:
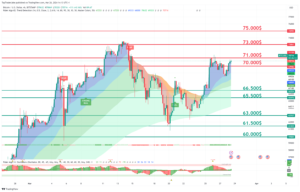
INTRO: BTC retesting 71.000$ as resistance.
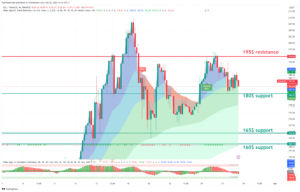
Technical analysis for the BTC/USDT chart:
Key Levels:
- Resistance: $68.000,$69.500
- Support: $62,000, $63,000
Strategy:
- Long: Buy at $67,100 with a stop loss below $65,000 and a target price of $73,000.
- Short: Sell at $73,000 with a stop loss above $75,500 and a target price of $65,000.
Range Description:
BTC/USDT is currently trading in a range between $65,000 and $71,000. The pair has broken into the range during the day. However, there are signs that the pair is ready to make a move with a possible retest of support.
On the upside, BTC/USDT is facing resistance at $71,000. The $71,000 level has been tested today, and if the price holds above it on the daily close, it will be confirmed as support. A break above $71,000 would signal a bullish breakout and could send the pair higher to $75,000.
On the downside, BTC/USDT is facing support at $65,500. This level was a previous resistance for the day and now holds as support. A break below $65,500 would signal a bearish breakdown, sending the pair lower to $60,000 or even $58,000.
BTC1D chart TW: https://www.tradingview.com/x/lsFj9Fcj/
ETH:
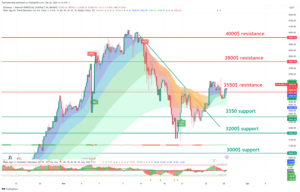
INTRO: ETH retesting 3550$ resistance.
Here is a technical analysis of the ETH/USDT chart:
Key Levels:
- Resistance: $3800, $3550
- Support: $3200, $3350
Strategy:
- Long: Buy at $3200 with a stop loss below $3000 and a target price of $4000.
- Short: Sell at $3600 with a stop loss above $3700 and a target price of $3000.
Range Description:
ETH/USDT is currently trading in a range between $3300 and $3600. The pair has broken into the range during the day. However, there are signs that the pair is ready to make a move with a possible retest of support.
On the upside, ETH/USDT is facing resistance at $3500. This level hasn’t been tested today, and if the price holds above it on the daily close, it will be confirmed as support. A break above $3500 would signal a bullish breakout and could send the pair higher to $3700.
On the downside, ETH/USDT is facing support at $3300. This level is a previous swing low and has been tested multiple times in recent weeks as resistance. A break below $3300 would signal a bearish breakdown and could send the pair lower to $3000 or even $2800.
ETH1D chart TW link: https://www.tradingview.com/x/3wW4VRyH/
XRP:
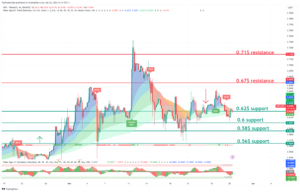
INTRO: XRP retesting 0.62$ support.
Here is a technical analysis of the XRP/USDT chart:
Key Levels:
- Resistance: $0.70, $0.67
- Support: $0.62, $0.64
Strategy:
- Long: Buy at $0.67 with a stop loss below $0.62 and a target price of $0.78.
- Short: Sell at $0.72 with a stop loss above $0.74 and a target price of $0.62.
Range Description:
XRP/USDT is currently trading in a range between $0.62 and $0.72. The pair has shifted into the range during the day. However, there are signs that the pair is ready to make a move with a possible retest of support.
On the upside, XRP/USDT is facing resistance at $0.70. This level has been tested today, and if the price holds above it on the daily close, it will be confirmed as support. A break above $0.70 would signal a bullish breakout and could send the pair higher to $0.72.
On the downside, XRP/USDT is facing support at $0.67. This level is a previous swing low and has been tested multiple times in recent weeks as significant support. A break below $0.67 would signal a bearish breakdown, sending the pair lower to $0.62 or even $0.60.
XRP chart TW link: https://www.tradingview.com/x/pA692txu/
LINK:
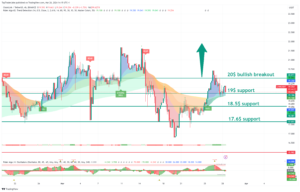
INTRO: LINK pushing to 20$.
Here is a technical analysis for the LINK/USDT chart:
Key Levels:
- Resistance: $20
- Support: $17.6
Strategy:
- Long: Buy at $17.6 with a stop loss below $17 and a target price of $20.
- Short: Sell at $20 with a stop loss above $21 and a target price of $17.6.
Range Description:
LINK/USDT is currently trading in a range between $17 and $20. The pair has shifted into the range during the day. However, there are signs that the pair is ready to make a move with a possible retest of support.
On the upside, LINK/USDT is facing resistance at $20. This level has been tested today, and if the price holds above the daily close, it will be confirmed as support. A break above $20 would signal a bullish breakout and could send the pair higher to $22.
On the downside, LINK/USDT is facing support at $17.6. This level is a previous swing low and has been tested multiple times in recent weeks as significant resistance. A break below $17.6 would signal a bearish breakdown and could send the pair lower to $17 or even $16.
LINK chart TW link: https://www.tradingview.com/x/aE8GIcpc/
SOL:
INTRO: SOL retest 195$ resistance.
Here is a technical analysis of the SOL/USDT chart:
Key Levels:
- Resistance: $135, $126
- Support: $120, 107$
Strategy:
- Long: Buy at $120 with a stop loss below $100 and a target price of $130.
- Short: Sell at $100 with a stop loss above $ 107 and a target price of $90.
Range Description:
SOL/USDT is currently trading in a range between $120 and $140. However, there are signs that the pair is ready to make a move to push strong resistance at $150.
On the upside, SOL/USDT is facing resistance at $135. This level has been tested today, and if the price holds above the daily close, it will be confirmed as support. A break above $135 would signal a bullish breakout and could send the pair higher to $150.
On the downside, SOL/USDT is facing support at $120. This level is a previous swing low and has been tested multiple times in recent weeks as significant support. A break below $120 would signal a bearish breakdown and could send the pair lower to $100 or even $90.
SOL chart TW link: https://www.tradingview.com/x/1IUS5QnJ/
CRYPTO NEWS:
HOW WE TRACK FLOWS BETWEEN BLOCKCHAINS
Check it out. We came across a new analytics tool to track crypto transferred between blockchains.
It’s a good way to see…
- Which blockchain investors are sending funds to, and
- Which blockchain investors are withdrawing funds from.
![]()
This is useful: New narratives and blockchains are popping up daily. It’s getting harder to keep up with than the Kardashians.
This helps you easily “follow the money” to see where most investors are looking… or sometimes, you can find hidden gems where people aren’t looking.
FAST NEWS:
A new spot Bitcoin ETF (Hashdex Bitcoin ETF) launched yesterday. The fund was originally launched in September 2022 but was limited to BTC futures contracts. Now, it’s been converted and is joining the big leagues.
Three AI tokens have entered into a proposed agreement to merge tokens. The 3 tokens are Fetch.ai, SingularityNET, and Ocean Protocol. If approved, they would merge into one single token ($ASI).
The NEAR Foundation dropped a new tool that lets users sign transactions on other supported blockchains. When enabled, DeFi protocols can utilize assets from other chains without requiring a cross-chain bridge. The supported chains include Bitcoin and Ethereum – with plans to support others (like Solana) in the future.
KuCoin and two of its founders have been indicted for allegedly violating the Bank Secrecy Act. The indictment accuses KuCoin of failing to maintain adequate anti-money laundering (AML) programs and knowingly serving U.S. customers without proper licenses.
The Abritrum Foundation is teaming up with Azuki and Weeb3 Foundation to launch a new blockchain-powered anime network. Dubbed AnimeChain, the new project aims to onboard fans of anime to web3 with a mix of content, games, merchandise, and NFTs.
HSBC launched new tokenized gold products for retail clients in Hong Kong. Retail customers can now access the HSBC Gold Token via online banking and the bank’s mobile app.
Final words:
The market looking to extend and bigger push-down is still an option.
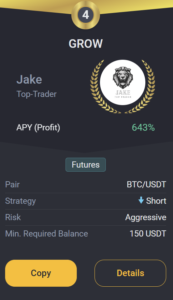
GROW BOT UPDATE:
Copy trade GROW 0.1->10k$ since 18.03.23 we got +219.0% PROFIT!
GROW CURRENTLY:
TRADING COIN: BTC/USDT
SETUP: SHORT
TAKE PROFIT: /
SAFETY ORDERS: /
Liquidation: /
Not Financial Advice!
Good luck with trades,
JAKE