The market is slow today as the US market doesn’t work.
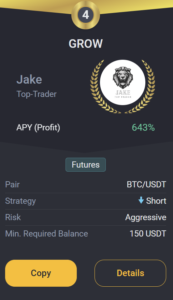
Jake
TOP Trader
BTC:
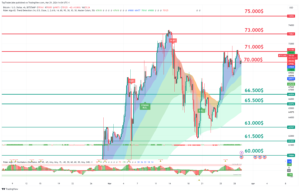
INTRO: BTC retesting 71.000$ as resistance.
Technical analysis for the BTC/USDT chart:
Key Levels:
- Resistance: $68.000,$69.500
- Support: $62,000, $63,000
Strategy:
- Long: Buy at $67,100 with a stop loss below $65,000 and a target price of $73,000.
- Short: Sell at $73,000 with a stop loss above $75,500 and a target price of $65,000.
Range Description:
BTC/USDT is currently trading in a range between $65,000 and $71,000. The pair has broken into the range during the day. However, there are signs that the pair is ready to make a move with a possible retest of support.
On the upside, BTC/USDT is facing resistance at $71,000. The $71,000 level has been tested today, and if the price holds above the daily close, it will be confirmed as support. A break above $71,000 would signal a bullish breakout and could send the pair higher to $75,000.
On the downside, BTC/USDT is facing support at $65,500. This level was a previous resistance for the day and is now holding as support. A break below $65,500 would signal a bearish breakdown, sending the pair lower to $60,000 or even $58,000.
BTC1D chart TW: https://www.tradingview.com/x/OA3oYmiK/
ETH:
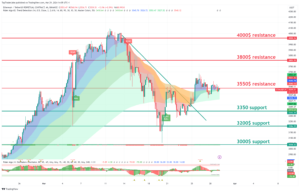
INTRO: ETH retesting 3550$ resistance.
Here is a technical analysis of the ETH/USDT chart:
Key Levels:
- Resistance: $3800, $3550
- Support: $3200, $3350
Strategy:
- Long: Buy at $3200 with a stop loss below $3000 and a target price of $4000.
- Short: Sell at $3600 with a stop loss above $3700 and a target price of $3000.
Range Description:
ETH/USDT is currently trading in a range between $3300 and $3600. The pair has broken into the range during the day. However, there are signs that the pair is ready to make a move with a possible retest of support.
On the upside, ETH/USDT is facing resistance at $3500. This level hasn’t been tested today, and if the price holds above the daily close, it will be confirmed as support. A break above $3500 would signal a bullish breakout and could send the pair higher to $3700.
On the downside, ETH/USDT is facing support at $3300. This level is a previous swing low and has been tested multiple times in recent weeks as resistance. A break below $3300 would signal a bearish breakdown and could send the pair lower to $3000 or even $2800.
ETH1D chart TW link: https://www.tradingview.com/x/rP4WfL2e/
XRP:
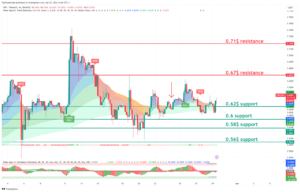
INTRO: XRP retesting 0.62$ support.
Here is a technical analysis of the XRP/USDT chart:
Key Levels:
- Resistance: $0.70, $0.67
- Support: $0.62, $0.64
Strategy:
- Long: Buy at $0.67 with a stop loss below $0.62 and a target price of $0.78.
- Short: Sell at $0.72 with a stop loss above $0.74 and a target price of $0.62.
Range Description:
XRP/USDT is currently trading in a range between $0.62 and $0.72. The pair has shifted into this range during the day. However, there are signs that the pair is ready to make a move with a possible retest of support.
On the upside, XRP/USDT is facing resistance at $0.70. This level has been tested today, and if the price holds above the daily close, it will be confirmed as support. A break above $0.70 would signal a bullish breakout and could send the pair higher to $0.72.
On the downside, XRP/USDT is facing support at $0.67. This level is a previous swing low and has been tested multiple times in recent weeks as significant support. A break below $0.67 would signal a bearish breakdown, sending the pair lower to $0.62 or even $0.60.
XRP chart TW link: https://www.tradingview.com/x/zsbBKCKi/
LINK:
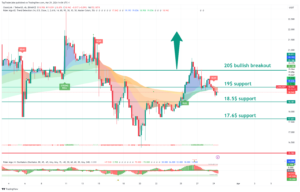
INTRO: LINK pushing to 20$.
Here is a technical analysis for the LINK/USDT chart:
Key Levels:
- Resistance: $20
- Support: $17.6
Strategy:
- Long: Buy at $17.6 with a stop loss below $17 and a target price of $20.
- Short: Sell at $20 with a stop loss above $21 and a target price of $17.6.
Range Description:
LINK/USDT is currently trading in a range between $17 and $20. The pair has shifted into this range during the day. However, there are signs that the pair is ready to make a move with a possible retest of support.
On the upside, LINK/USDT is facing resistance at $20. This level has been tested today, and if the price holds above the daily close, it will be confirmed as support. A break above $20 would signal a bullish breakout and could send the pair higher to $22.
On the downside, LINK/USDT is facing support at $17.6. This level is a previous swing low and has been tested multiple times in recent weeks as significant resistance. A break below $17.6 would signal a bearish breakdown and could send the pair lower to $17 or even $16.
LINK chart TW link: https://www.tradingview.com/x/7IBjibBM/
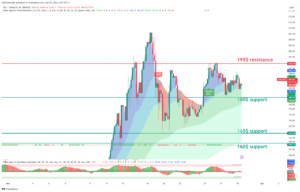
SOL:
INTRO: SOL retest 195$ resistance.
Here is a technical analysis of the SOL/USDT chart:
Key Levels:
- Resistance: $135, $126
- Support: $120, 107$
Strategy:
- Long: Buy at $120 with a stop loss below $100 and a target price of $130.
- Short: Sell at $100 with a stop loss above $ 107 and a target price of $90.
Range Description:
SOL/USDT is currently trading in a range between $120 and $140. However, there are signs that the pair is ready to make a move to push strong resistance at $150.
On the upside, SOL/USDT is facing resistance at $135. This level has been tested today, and if the price holds above the daily close, it will be confirmed as support. A break above $135 would signal a bullish breakout and could send the pair higher to $150.
On the downside, SOL/USDT is facing support at $120. This level is a previous swing low and has been tested multiple times in recent weeks as significant support. A break below $120 would signal a bearish breakdown and could send the pair lower to $100 or even $90.
SOL chart TW link: https://www.tradingview.com/x/XMfKa0KT/
CRYPTO NEWS:
$15.2B IN QUARTERLY OPTIONS CONTRACTS ARE EXPIRING
Q1 is coming to a close. This means two monumental events are happening…
1/ My wife and I are having our first “quarterly expense exposé” ever. And she’s like the blockchain… she keeps all the receipts. (AKA I’m f*cked. Send help)
2/ Over $15B in quarterly options contracts are expiring today.
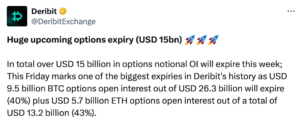
Now, in case this all looks like gibberish, let’s break it down in simple terms…
Options contracts give investors the right to buy or sell cryptocurrencies (like BTC) for a predetermined price, at some point in the future.
In this case, the end of the quarter.
It’s kinda like betting on who will win the Super Bowl before the season starts.
And today, a lot of investors find out whether they won their bets or not. Here’s why this is a big deal…
- It’s one of Deribit’s largest expiries ever. For reference, Deribit makes up about 85% of the global crypto options market.
- A lot of contracts expiring are “in the money”. If BTC and ETH stay at current prices, the contracts will be profitable and investors might try to cash out.
- This could lead to volatility in the market. When so many of these options contracts expire at once, prices can swing up or down within minutes. (pack a brown paper bag if you get motion sickness)
It also gives us a glimpse into the “market’s mood”. How traders react to this expiry can give us hints about what’s coming next. If most people are optimistic and keep investing, we might see prices go up. If they get nervous and sell off, prices could drop.
Turns out that these options contracts and cycles of expiries play a big role in the crypto market too. So buckle up, today could be another wild day.
FAST NEWS:
Bitcoin’s rally caused VCs to “aggressively return to crypto”. According to Craig Burel of Reciprocal Ventures, venture capitalists are flocking back to the industry after the recent rally.
Fidelity added staking to its ETH ETF proposal. Fidelity is one of several issuers trying to launch a spot Ether ETF just months after the SEC greenlit BTC ETFs.
Sam Bankman-Fried has been sentenced to 25 years in prison on 7 counts of fraud and conspiracy. **sniff sniff**… Do you smell that? It’s the sweet, sweet smell of justice.
More Hong Kong-based asset managers have started applying for spot Bitcoin ETFs. Earlier this week, a report from Bloomberg Intelligence said Hong Kong regulators are likely to allow in-kind creations and redemptions for spot bitcoin ETFs in Q2 of this year.
BlackRock’s new tokenized investment fund (BUIDL) received $160M in net inflows during its first week. BlackRock’s USD Institutional Digital Liquidity Fund (BUIDL) is a tokenized fund that invests in U.S. Treasury bills, repurchase agreements, and cash.
Final words:
The market could push up strong up and down so take your positions.
GROW BOT UPDATE:
Copy trade GROW 0.1->10k$ since 18.03.23 we got +219.0% PROFIT!
GROW CURRENTLY:
TRADING COIN: BTC/USDT
SETUP: SHORT
TAKE PROFIT: /
SAFETY ORDERS: /
Liquidation: /
Not Financial Advice!
Good luck with trades,
JAKE