Altcoins is holding support but still lacks buy pressure.
Jake
TOP Trader
BTC:
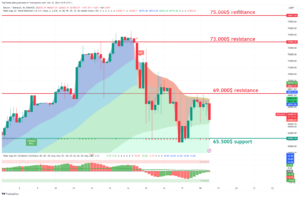
INTRO: BTC retesting 65.500$ as support.
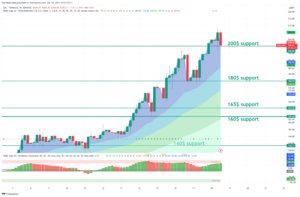
Technical analysis for the BTC/USDT chart:
Key Levels:
- Resistance: $75.000,$72.500
- Support: $69,000, $67,200
Strategy:
- Long: Buy at $69,100 with a stop loss below $65,000 and a target price of $75,000.
- Short: Sell at $75,000 with a stop loss above $77,500 and a target price of $69,000.
Range Description:
BTC/USDT is currently trading in a range between $67,000 and $73,000. The pair has broken into range during the day. However, there are signs that the pair is ready to make a move with possible retest of support.
On the upside, BTC/USDT is facing resistance at $73,000. And 73,000$ level has been tested today, and if the price is above the daily close, it will be confirmed as support. A break above $73,000 would signal a bullish breakout and could send the pair higher to $80,000.
On the downside, BTC/USDT is facing support at $48,500. This level was previously resistance for the day and now holds as support. A break below $48,500 would signal a bearish breakdown and could send the pair lower to $45,000 or even $42,000.
BTC1D chart TW https://www.tradingview.com/x/etTtZflI/
ETH:
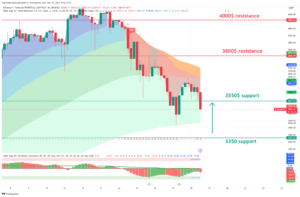
INTRO: ETH retesting 3550$ support.
Here is a technical analysis of the ETH/USDT chart:
Key Levels:
- Resistance: $4000, $3800
- Support: $3700, $3600
Strategy:
- Long: Buy at $3700 with a stop loss below $3600 and a target price of $4000.
- Short: Sell at $4000 with a stop loss above $4100 and a target price of $3800.
Range Description:
ETH/USDT is currently trading in a range between $3800 and $4000. The pair has broken into range during the day. However, there are signs that the pair is ready to make a move with possible retest of support.
On the upside, ETH/USDT is facing resistance at $4000. This level hasn’t been tested today, and if the price holds above it at the daily close, it will be confirmed as support. A break above $4000 would signal a bullish breakout and could send the pair higher to $4100.
On the downside, ETH/USDT is facing support at $3800. This level is a previous swing low and has been tested multiple times in recent weeks as resistance. A break below $3800 would signal a bearish breakdown and could send the pair lower to $3700 or even $3600.
ETH1D chart TW link: https://www.tradingview.com/x/sFy2wgRz/
XRP:
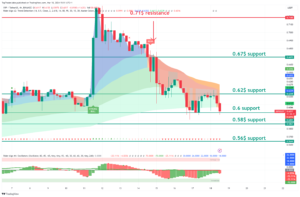
INTRO: XRP retesting 0.6$ support.
Here is a technical analysis of the XRP/USDT chart:
Key Levels:
- Resistance: $0.70, $0.67
- Support: $0.62, $0.64
Strategy:
- Long: Buy at $0.67 with a stop loss below $0.62 and a target price of $0.78.
- Short: Sell at $0.72 with a stop loss above $0.74 and a target price of $0.62.
Range Description:
XRP/USDT is currently trading in a range between $0.62 and $0.72. The pair has shifted into range during the day. However, there are signs that the pair is ready to make a move with possible retest of support.
On the upside, XRP/USDT is facing resistance at $0.70. This level has been tested today, and if the price holds above the daily close, it will be confirmed as support. A break above $0.70 would signal a bullish breakout and could send the pair higher to $0.72.
On the downside, XRP/USDT is facing support at $0.67. This level is a previous swing low and has been tested multiple times in recent weeks as significant support. A break below $0.67 would signal a bearish breakdown and could send the pair lower to $0.62 or even $0.60.
XRP chart TW link: https://www.tradingview.com/x/lDfrNoiG/
LINK:
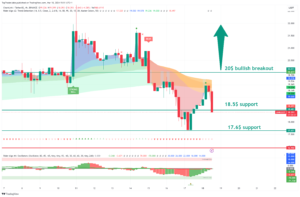
INTRO: LINK retest support at 18.5$.
Here is a technical analysis for the LINK/USDT chart:
Key Levels:
- Resistance: $20
- Support: $17.6
Strategy:
- Long: Buy at $17.6 with a stop loss below $17 and a target price of $20.
- Short: Sell at $20 with a stop loss above $21 and a target price of $17.6.
Range Description:
LINK/USDT is currently trading in a range between $17 and $20. The pair has shifting into range during day. However, there are signs that the pair is ready to make a move with possible retest of support.
On the upside, LINK/USDT is facing resistance at $20. This level has been tested today, and if the price holds above it at the daily close, it will be confirmed as support. A break above $20 would signal a bullish breakout and could send the pair higher to $22.
On the downside, LINK/USDT is facing support at $17.6. This level is a previous swing low and has been tested multiple times in recent weeks as significant resistance. A break below $17.6 would signal a bearish breakdown and could send the pair lower to $17 or even $16.
LINK chart TW link: https://www.tradingview.com/x/BlhQM7oC/
SOL:
INTRO: SOL retest 200$ support.
Here is a technical analysis of the SOL/USDT chart:
Key Levels:
- Resistance: $135, $126
- Support: $120, 107$
Strategy:
- Long: Buy at $120 with a stop loss below $100 and a target price of $130.
- Short: Sell at $100 with a stop loss above $107 and a target price of $90.
Range Description:
SOL/USDT is currently trading in a range between 120$ and 140$. However, there are signs that the pair is ready to make a move to push strong resistance at 150$.
On the upside, SOL/USDT is facing resistance at $135. This level has been tested today, and if the price holds above the daily close, it will be confirmed as support. A break above $135 would signal a bullish breakout and could send the pair higher to $150.
On the downside, SOL/USDT is facing support at $120. This level is a previous swing low and has been tested multiple times in recent weeks as significant support. A break below $120 would signal a bearish breakdown and could send the pair lower to $100 or even $90.
SOL chart TW link: https://www.tradingview.com/x/BlhQM7oC/
CRYPTO NEWS:
MEET THE $100M MEMECOIN FUND
Earlier this year, the Avalanche Foundation launched a $100M fund called “Culture Catalyst.”
It’s focused on one type of asset… “community coins.” Which is just another way of saying memecoins.
(It’s like when my wife pronounces Target as ‘’Targét” to feel fancy).
Well, check it out. The Avalanche Foundation announced its first 5 investments…
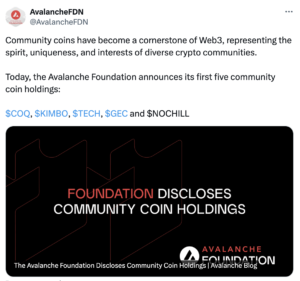
Does investing in something called “COQ” sound crazy? Yes. (Say it out loud, and you’ll get the joke).
Do we think more memecoin funds will be launched in the future? Also yes.
FAST NEWS:
Solana’s market cap hit a new all-time high. It hit $81.1B this morning – breaking its previous record of $77.9B back in November 2021.
According to a new Paradigm survey, 19% of U.S. voters have bought crypto. The survey also found that 6% of crypto-owning voters hold between $1,001 and $10,000 – showing that there’s a large group with vested financial interests.
Robinhood reported that its crypto trade volume jumped 10% in February. The trading platform saw $6.5B worth of volume – the highest since the middle of 2022.
VeVe launched a new digital comic book reader and platform called VeVe Comics. Fans now have access to 300+ new Marvel digital issues, including those based on Spider-Man, X-Men, Captain Marvel, and Black Panther.
Global crypto investment products crossed $100B in AUM for the first time ever. Global crypto funds have witnessed record inflows in recent weeks, which, combined with recent price gains in the crypto market, have led to the AUM record.
The Arbitrum Foundation submitted a new DAO proposal to launch a $400M crypto gaming fund. If approved, the fund would invest in and promote crypto games on the Arbitrum blockchain.
Final words:
The market dip is an excellent entry point for new long setups.
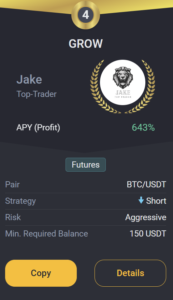
GROW BOT UPDATE:
Copy trade GROW 0.1->10k$ since 18.03.23 we got +219.0% PROFIT!
GROW CURRENTLY:
TRADING COIN: BTC/USDT
SETUP: SHORT
TAKE PROFIT: /
SAFETY ORDERS: /
Liquidation: /
Not Financial Advice!
Good luck with trades,
JAKE