ETH is following up with BTC and needs to break strong resistance.
Jake
TOP Trader
BTC:
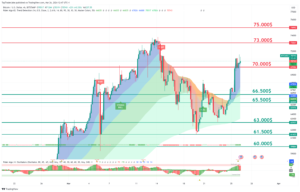
INTRO: BTC retesting 71.000$ as resistance.
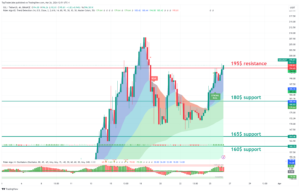
Technical analysis for the BTC/USDT chart:
Key Levels:
- Resistance: $68.000,$69.500
- Support: $62,000, $63,000
Strategy:
- Long: Buy at $67,100 with a stop loss below $65,000 and a target price of $73,000.
- Short: Sell at $73,000 with a stop loss above $75,500 and a target price of $65,000.
Range Description:
BTC/USDT is currently trading in a range between $65,000 and $71,000. The pair has broken into this range during the day. However, there are signs that the pair is ready to make a move with a possible retest of support.
On the upside, BTC/USDT is facing resistance at $71,000. This level has been tested today, and if the price holds above it on the daily close, it will be confirmed as support. A break above $71,000 would signal a bullish breakout and could send the pair higher to $75,000.
On the downside, BTC/USDT is facing support at $65,500. This level was a previous resistance for the day and is now holding as support. A break below $65,500 would signal a bearish breakdown, sending the pair lower to $60,000 or even $58,000.
BTC1D chart TW: https://www.tradingview.com/x/WtkN5KSj/
ETH:
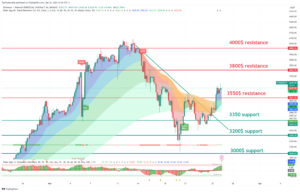
INTRO: ETH retesting 3550$ resistance.
Here is a technical analysis of the ETH/USDT chart:
Key Levels:
- Resistance: $3800, $3550
- Support: $3200, $3350
Strategy:
- Long: Buy at $3200 with a stop loss below $3000 and a target price of $4000.
- Short: Sell at $3600 with a stop loss above $3700 and a target price of $3000.
Range Description:
ETH/USDT is currently trading in a range between $3300 and $3600. The pair has broken into this range during the day. However, there are signs that the pair is ready to make a move with a possible retest of support.
On the upside, ETH/USDT is facing resistance at $3500. This level has not been tested today, and if the price holds above it on the daily close, it will be confirmed as support. A break above $3500 would signal a bullish breakout and could send the pair higher to $3700.
On the downside, ETH/USDT is facing support at $3300. This level is a previous swing low and has been tested multiple times in recent weeks as resistance. A break below $3300 would signal a bearish breakdown and could send the pair lower to $3000 or even $2800.
ETH1D chart TW link: https://www.tradingview.com/x/VkPdYYM3/
XRP:
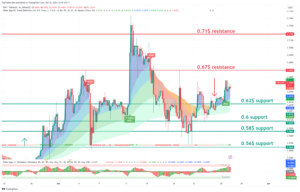
INTRO: XRP retesting 0.67$ resistance.
Here is a technical analysis of the XRP/USDT chart:
Key Levels:
- Resistance: $0.70, $0.67
- Support: $0.62, $0.64
Strategy:
- Long: Buy at $0.67 with a stop loss below $0.62 and a target price of $0.78.
- Short: Sell at $0.72 with a stop loss above $0.74 and a target price of $0.62.
Range Description:
XRP/USDT is currently trading between $0.62 and $0.72. The pair has shifted into this range during the day. However, there are signs that the pair is ready to make a move with a possible retest of support.
On the upside, XRP/USDT is facing resistance at $0.70. This level has been tested today, and if the price holds above it on the daily close, it will be confirmed as support. A break above $0.70 would signal a bullish breakout and could send the pair higher to $0.72.
On the downside, XRP/USDT is facing support at $0.67. This level is a previous swing low and has been tested multiple times in recent weeks as significant support. A break below $0.67 would signal a bearish breakdown, sending the pair lower to $0.62 or even $0.60.
XRP chart TW link: https://www.tradingview.com/x/MlXAoGLt/
LINK:
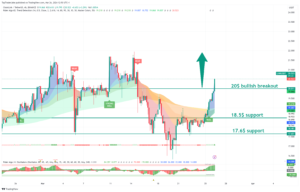
INTRO: LINK break bullish above 20$.
Here is a technical analysis for the LINK/USDT chart:
Key Levels:
- Resistance: $20
- Support: $17.6
Strategy:
- Long: Buy at $17.6 with a stop loss below $17 and a target price of $20.
- Short: Sell at $20 with a stop loss above $21 and a target price of $17.6.
Range description:
LINK/USDT is currently trading in a range between $17 and $20. The pair has shifted into this range during the day. However, there are signs that the pair is ready to make a move with a possible retest of support.
On the upside, LINK/USDT is facing resistance at $20. This level has been tested today, and if the price holds above it on the daily close, it will be confirmed as support. A break above $20 would signal a bullish breakout and could send the pair higher to $22.
On the downside, LINK/USDT is facing support at $17.6. This level is a previous swing low and has been tested multiple times in recent weeks as significant resistance. A break below $17.6 would signal a bearish breakdown and could send the pair lower to $17 or even $16.
LINK chart TW link: https://www.tradingview.com/x/S6kCHbx0/
SOL:
INTRO: SOL retest 195$ resistance.
Here is a technical analysis for the SOL/USDT chart:
Key Levels:
- Resistance: $135, $126
- Support: $120, 107$
Strategy:
- Long: Buy at $120 with a stop loss below $100 and a target price of $130.
- Short: Sell at $100 with a stop loss above $107and a target price of $90.
Range description:
SOL/USDT is currently trading in a range between $120 and $140. However, there are signs that the pair is ready to make a move to push strong resistance at $150.
On the upside, SOL/USDT is facing resistance at $135. This level has been tested today, and if the price holds above it on the daily close, it will be confirmed as support. A break above $135 would signal a bullish breakout and could send the pair higher to $150.
On the downside, SOL/USDT is facing support at $120. This level is a previous swing low and has been tested multiple times in recent weeks as significant support. A break below $120 would signal a bearish breakdown and could send the pair lower to $100 or even $90.
SOL chart TW link: https://www.tradingview.com/x/brRwtS3u/
CRYPTO NEWS:
GRAPH OF THE DAY: THE 7-WEEK STREAK IS OVER
They say all great things must come to an end…
MySpace. The Sopranos. Backyard Baseball. Being able to eat whatever you want without gaining weight.
Now… crypto’s 7-week streak of inflows has joined the list.
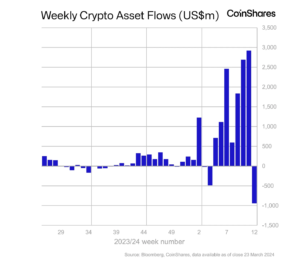
According to CoinShares’ latest report:
- Digital asset investment products saw $942M in outflows last week – a new weekly outflow record.
- BTC led the way with $904M in outflows. Other major cryptocurrencies like ETH (-$34.2) and SOL (-$5.6M) also saw minor sell-offs.
- Other altcoins saw minor inflows. $DOT, $AVAX, and $LTC saw net inflows totaling +$16M.
- The majority of the sell-off (~$2B) came from Grayscale’s Bitcoin ETF. Most of the other ETFs saw inflows (totaling $1.1B), but it wasn’t enough to offset Grayscale’s garage sale.
- CoinShares’ experts believe last week’s price correction was due to “hesitancy from investors”, which led to lower inflows.
We’ll see if inflows can bounce back this week.
FAST NEWS:
More than 50% of Solana transactions have failed over the last month. Most of the failed transactions are from trading bots, while transactions from real users often fail due to slippage. —DL News
A new email phishing campaign is targeting BlockFi and FTX creditors. So far, over $7M has been stolen from creditors. (Milk Road Rule #28: If it smells phishy, it probably is!)
Goldman Sachs is seeing a resurgence in interest in crypto-related products from its hedge fund clients. The investment bank says they’ve also been exploring investing in crypto bankruptcy claims.
ApeCoin DAO signed a multi-year partnership with a Formula One team. It’s still confidential which F1 team the partnership is with, but ApeCoin DAO says the team finished in the Top 6 last year.
Kevin Hart sold his Bored Ape Yacht Club NFT. And he took a smooth 83% LOSS on the investment.
Final words:
BTC break out but altcoins still need bigger push up to maintain strong bounce up.
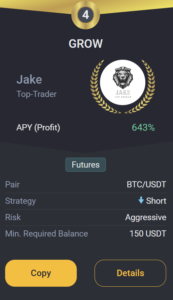
GROW BOT UPDATE:
Copy trade GROW 0.1->10k$ since 18.03.23 we got +219.0% PROFIT!
GROW CURENTLY:
TRADING COIN: BTC/USDT
SETUP: SHORT
TAKE PROFIT: /
SAFETY ORDERS: /
Liquidation: /
Not Financial Advice!
Good luck with trades,
JAKE