ETH hitting strong resistance will it push back .
Jake
TOP Trader
BTC:
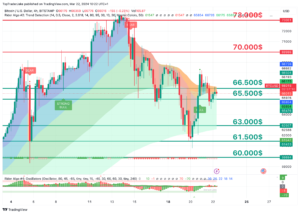
INTRO: BTC retesting 65.000$ as resistance.
Technical analysis for the BTC/USDT chart:
Key Levels:
- Resistance: $65.000,$65.500
- Support: $62,000, $63,000
Strategy:
- Long: Buy at $60,100 with a stop loss below $58,000 and a target price of $69,000.
- Short: Sell at $65,000 with a stop loss above $67,500 and a target price of $60,000.
Range Description:
BTC/USDT is currently trading in a range between $60,000 and $65,000. The pair has broken into this range during the day. However, there are signs that the pair is ready to make a move with a possible retest of support.
On the upside, BTC/USDT is facing resistance at $63,000. The $63,000 level has been tested today, and if the price holds above it on the daily close, it will be confirmed as support. A break above $63,000 would signal a bullish breakout and could send the pair higher to $65,000.
On the downside, BTC/USDT is facing support at $62,500. This level was a previous resistance for the day and now holds as support. A break below $62,500 would signal a bearish breakdown, sending the pair lower to $58,000 or even $50,000.
BTC1D chart TW: https://www.tradingview.com/x/ctPoMCIZ/
ETH:
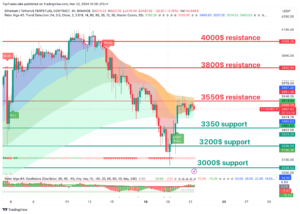
INTRO: ETH pushing 3500$ as resistance.
Here is a technical analysis of the ETH/USDT chart:
Key Levels:
- Resistance: $3300, $3500
- Support: $3200, $3000
Strategy:
- Long: Buy at $3200 with a stop loss below $3000 and a target price of $4000.
- Short: Sell at $3300 with a stop loss above $3500 and a target price of $3000.
Range Description:
ETH/USDT is currently trading in a range between $3000 and $3300. The pair has broken into this range during the day. However, there are signs that the pair is ready to make a move with a possible retest of support.
On the upside, ETH/USDT is facing resistance at $3300. This level hasn’t been tested today, and if the price holds above it on the daily close, it will be confirmed as support. A break above $3300 would signal a bullish breakout and could send the pair higher to $3500.
On the downside, ETH/USDT is facing support at $3200. This level is a previous swing low and has been tested multiple times in recent weeks as resistance. A break below $3200 would signal a bearish breakdown and could send the pair lower to $3000 or even $2800.
ETH1D chart TW link: https://www.tradingview.com/x/PHZImrhq/
XRP:
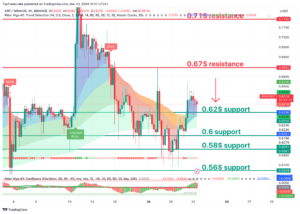
INTRO: XRP retesting 0.62$ support.
Here is a technical analysis of the XRP/USDT chart:
Key Levels:
- Resistance: $0.70, $0.67
- Support: $0.62, $0.64
Strategy:
- Long: Buy at $0.67 with a stop loss below $0.62 and a target price of $0.78.
- Short: Sell at $0.72 with a stop loss above $0.74 and a target price of $0.62.
Range Description:
XRP/USDT is currently trading in a range between $0.62 and $0.72. The pair has shifted into this range during the day. However, there are signs that the pair is ready to make a move with a possible retest of support.
On the upside, XRP/USDT is facing resistance at $0.70. This level has been tested today, and if the price holds above it on the daily close, it will be confirmed as support. A break above $0.70 would signal a bullish breakout and could send the pair higher to $0.72.
On the downside, XRP/USDT is facing support at $0.67. This level is a previous swing low and has been tested multiple times in recent weeks as significant support. A break below $0.67 would signal a bearish breakdown, sending the pair lower to $0.62 or even $0.60.
XRP chart TW link: https://www.tradingview.com/x/3yQJDLSr/
LINK:
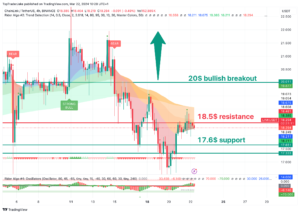
INTRO: LINK retest support at 17.5$.
Here is a technical analysis for the LINK/USDT chart:
Key Levels:
- Resistance: $20
- Support: $17.6
Strategy:
- Long: Buy at $17.6 with a stop loss below $17 and a target price of $20.
- Short: Sell at $20 with a stop loss above $21 and a target price of $17.6.
Range Description:
LINK/USDT is currently trading in a range between $17 and $20. The pair has shifted into this range during the day. However, there are signs that the pair is ready to make a move with a possible retest of support.
On the upside, LINK/USDT is facing resistance at $20. This level has been tested today, and if the price holds above it on the daily close, it will be confirmed as support. A break above $20 would signal a bullish breakout and could send the pair higher to $22.
On the downside, LINK/USDT is facing support at $17.6. This level is a previous swing low and has been tested multiple times in recent weeks as significant resistance. A break below $17.6 would signal a bearish breakdown and could send the pair lower to $17 or even $16.
LINK chart TW link: https://www.tradingview.com/x/AiUGwgjR/
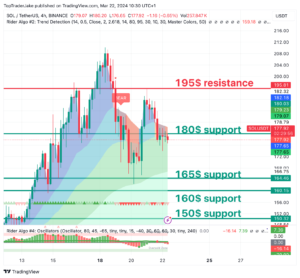
SOL:
INTRO: SOL retest 180$ support.
Here is a technical analysis of the SOL/USDT chart:
Key Levels:
- Resistance: $135, $126
- Support: $120, 107$
Strategy:
- Long: Buy at $120 with a stop loss below $100 and a target price of $130.
- Short: Sell at $100 with a stop loss above $ 107 and a target price of $90.
Range Description:
SOL/USDT is currently trading in a range between $120 and $140. However, there are signs that the pair is ready to make a move to push strong resistance at $150.
On the upside, SOL/USDT is facing resistance at $135. This level has been tested today, and if the price holds above it on the daily close, it will be confirmed as support. A break above $135 would signal a bullish breakout and could send the pair higher to $150.
On the downside, SOL/USDT is facing support at $120. This level is a previous swing low and has been tested multiple times in recent weeks as significant support. A break below $120 would signal a bearish breakdown and could send the pair lower to $100 or even $90.
SOL chart TW link: https://www.tradingview.com/x/rdQ1EKqh/
CRYPTO NEWS:
CHART OF THE DAY: THE MOST POPULAR BLOCKCHAIN ECOSYSTEMS
CoinGecko just dropped a report on the most popular blockchain ecosystems this year…
The results?
- Solana is leading the way with 49.3% of global crypto investor interest. Strong performances from key ecosystem projects and memecoins have fueled this.
- Ethereum is in second place with 12.7%. This is likely due to high gas fees and Solana memecoins turning into crypto’s “new shiny object.”
- BNB Smart Chain is in third with 5.4%. The ecosystem has grown on the back of BNB’s price rallying near its all-time high.
Check out the rest of the standings below:

FAST NEWS:
RWA tokens and memecoins have seen big gains over the last 24 hours. The RWA market cap jumped 31%, while the memecoin market cap is up 16%.
U.S. interest rates hold steady for the 5th consecutive FOMC meeting. Projections are now only calling for 3 rounds of rate cuts by the end of the year.
Coinbase will launch futures trading for Dogecoin, Litecoin, and Bitcoin Cash starting April 1st. $DOGE (+15.9%), $LTC (+6%), and $BCH (+12.7%) are all up in price over the last 24 hours.
Robinhood rolled out its crypto wallets to Android users globally. The wallet allows users to hold private keys, granting them control over their digital assets.
The TON Foundation is launching a new $100M+ ‘community rewards initiative’. The funds will be allocated to competing projects and TON ecosystem users starting next month.
Tyrese Haliburton is considering taking a portion of his NBA salary in crypto. FYI – Haliburton currently has a 5-year $260M contract.
Final words:
It is Friday be aware of the last push-down before the next leg-up.
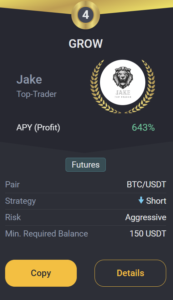
GROW BOT UPDATE:
Copy trade GROW 0.1->10k$ since 18.03.23 we got +219.0% PROFIT!
GROW CURRENTLY:
TRADING COIN: BTC/USDT
SETUP: SHORT
TAKE PROFIT: /
SAFETY ORDERS: /
Liquidation: /
Not Financial Advice!
Good luck with trades,
JAKE