Altcoins showing weakness and slowing in momentum.
Jake
TOP Trader
BTC:
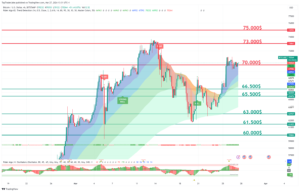
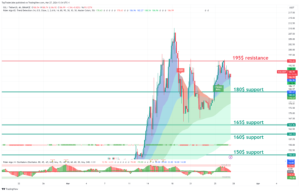
INTRO: BTC retesting 71.000$ as resistance.
Technical analysis for the BTC/USDT chart:
Key Levels:
- Resistance: $68.000,$69.500
- Support: $62,000, $63,000
Strategy:
- Long: Buy at $67,100 with a stop loss below $65,000 and a target price of $73,000.
- Short: Sell at $73,000 with a stop loss above $75,500 and a target price of $65,000.
Range Description:
BTC/USDT is currently trading in a range between $65,000 and $71,000. The pair has broken into this range during the day. However, there are signs that the pair is ready to make a move with a possible retest of support.
On the upside, BTC/USDT is facing resistance at $71,000. The $71,000 level has been tested today, and if the price holds above it on the daily close, it will be confirmed as support. A break above $71,000 would signal a bullish breakout and could send the pair higher to $75,000.
On the downside, BTC/USDT is facing support at $65,500. This level was a previous resistance for the day and now holds as support. A break below $65,500 would signal a bearish breakdown, sending the pair lower to $60,000 or even $58,000.
BTC1D chart TW: https://www.tradingview.com/x/xlLYLXya/
ETH:
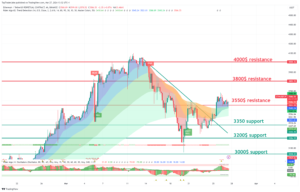
INTRO: ETH retesting 3550$ resistance.
Here is a technical analysis of the ETH/USDT chart:
Key Levels:
- Resistance: $3800, $3550
- Support: $3200, $3350
Strategy:
- Long: Buy at $3200 with a stop loss below $3000 and a target price of $4000.
- Short: Sell at $3600 with a stop loss above $3700 and a target price of $3000.
Range Description:
ETH/USDT is currently trading in a range between $3300 and $3600. The pair has broken into this range during the day. However, there are signs that the pair is ready to make a move with a possible retest of support.
On the upside, ETH/USDT is facing resistance at $3500. This level hasn’t been tested today, and if the price holds above it on the daily close, it will be confirmed as support. A break above $3500 would signal a bullish breakout and could send the pair higher to $3700.
On the downside, ETH/USDT is facing support at $3300. This level is a previous swing low and has been tested multiple times in recent weeks as resistance. A break below $3300 would signal a bearish breakdown and could send the pair lower to $3000 or even $2800.
ETH1D chart TW link: https://www.tradingview.com/x/AUphsIXp/
XRP:
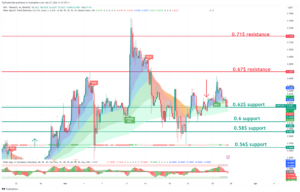
INTRO: XRP retesting 0.62$ support.
Here is a technical analysis of the XRP/USDT chart:
Key Levels:
- Resistance: $0.70, $0.67
- Support: $0.62, $0.64
Strategy:
- Long: Buy at $0.67 with a stop loss below $0.62 and a target price of $0.78.
- Short: Sell at $0.72 with a stop loss above $0.74 and a target price of $0.62.
Range Description:
XRP/USDT is currently trading between $0.62 and $0.72. The pair has shifted into this range during the day. However, there are signs that the pair is ready to make a move with a possible retest of support.
On the upside, XRP/USDT is facing resistance at $0.70. This level has been tested today, and if the price holds above it on the daily close, it will be confirmed as support. A break above $0.70 would signal a bullish breakout and could send the pair higher to $0.72.
On the downside, XRP/USDT is facing support at $0.67. This level is a previous swing low and has been tested multiple times in recent weeks as significant support. A break below $0.67 would signal a bearish breakdown, sending the pair lower to $0.62 or even $0.60.
XRP chart TW link: https://www.tradingview.com/x/YqmSmiPi/
LINK:
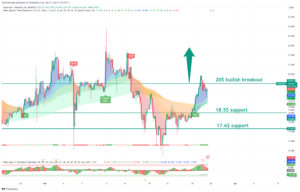
INTRO: LINK pushing to 20$.
Here is a technical analysis for the LINK/USDT chart:
Key Levels:
- Resistance: $20
- Support: $17.6
Strategy:
- Long: Buy at $17.6 with a stop loss below $17 and a target price of $20.
- Short: Sell at $20 with a stop loss above $21 and a target price of $17.6.
Range Description:
LINK/USDT is currently trading between $17 and $20. The pair has shifted into this range during the day. However, there are signs that the pair is ready to make a move with a possible retest of support.
On the upside, LINK/USDT is facing resistance at $20. This level has been tested today, and if the price holds above it on the daily close, it will be confirmed as support. A break above $20 would signal a bullish breakout and could send the pair higher to $22.
On the downside, LINK/USDT is facing support at $17.6. This level is a previous swing low and has been tested multiple times in recent weeks as significant resistance. A break below $17.6 would signal a bearish breakdown and could send the pair lower to $17 or even $16.
LINK chart TW link: https://www.tradingview.com/x/eAboLvu2/
SOL:
INTRO: SOL retest 195$ resistance.
Here is a technical analysis of the SOL/USDT chart:
Key Levels:
- Resistance: $135, $126
- Support: $120, 107$
Strategy:
- Long: Buy at $120 with a stop loss below $100 and a target price of $130.
- Short: Sell at $100 with a stop loss above $ 107 and a target price of $90.
Range Description:
SOL/USDT is currently trading between $120 and $140. However, there are signs that the pair is ready to make a move to push strong resistance at $150.
On the upside, SOL/USDT is facing resistance at $135. This level has been tested today, and if the price holds above it on the daily close, it will be confirmed as support. A break above $135 would signal a bullish breakout and could send the pair higher to $150.
On the downside, SOL/USDT is facing support at $120. This level is a previous swing low and has been tested multiple times in recent weeks as significant support. A break below $120 would signal a bearish breakdown and could send the pair lower to $100 or even $90.
SOL chart TW link: https://www.tradingview.com/x/bqgd5kjO/
CRYPTO NEWS:
BTC ETFS ARE FLOWING AGAIN AND THE ETH ETF DEBATE HEATS UP
There were 2 pieces of big news in ETF-land…
1/ BTC ETFs are seeing inflows again.
Last week was rough for Bitcoin ETFs… 5 straight days of sell-offs. $888M in total outflows.
Our sources tell us institutional investors spent the week sulking over the better days while listening to “Marvin’s Room” (aka the ‘sad boy’ anthem).
Well, it’s a brand new week, baby! And we’re off to a strong start…
BTC ETFs saw $15.7M in net inflows yesterday.
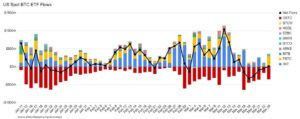
Why this matters: There’s been a correlation between BTC ETF flows and BTC’s price…
When there are inflows, BTC’s price usually goes up. Since the BTC ETFs launched, they’ve seen $11.2B in total inflows. BTC’s price is up +52% in that time.
When there are outflows, BTC’s price usually goes down. For example, last week’s 5-day streak of outflows sent BTC to the clearance rack. (It was down -8%).
And speaking of ETFs…
2/ Grayscale’s Chief Legal Officer believes ETH ETFs “should be approved”.
Now that the BTC ETFs have been approved, all eyes are on… ETH ETFs.
They’re similar to BTC ETFs – except instead of getting exposure to BTC, you get exposure to ETH.
But there’s been a lot of debate on whether an ETH ETF will be approved. Eric Balchunas (Bloomberg’s ETF guru) thinks there’s a 25% chance of approval this year.
Well, a new fighter has entered the ring… Craig Salm, Grayscale’s Chief Legal Officer.
(Side note: Cartels call Saul Goodman to keep them out of trouble. Grayscale calls Craig).
And he thinks there’s a good chance an ETH ETF does get approved soon…
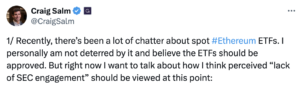
Why this matters: If an ETH ETF does get approved, it could lead to a big ETH rally – similar to what BTC ETFs did for BTC.
P.S. – it could also lead to a rally for ‘ETH-beta’ investments (i.e. Ethereum L2s and ETH staking protocols).
FAST NEWS:
The London Stock Exchange plans to list crypto ETNs (exchange-traded notes) at the end of May. The stock exchange will accept applications for trading BTC and ETH crypto exchange-traded notes starting April 8.
Nilam Resources entered into a Letter of Intent (LOI) to purchase 24,800 BTC, worth ~$1.7B. The crazy part? Nilam is a tiny gold mining company with a $4M market cap. Hmm… smells fishy. (This is like if I – a guy who can barely jump over a rock and whose height starts with a ‘5’ – declared for the NBA draft).
BTC’s price volatility led to $193M in liquidations yesterday. The majority of them ($129M) were short positions.
Coinbase International’s daily trading volume is soaring. There have only been five days in March where daily trading volume fell below the $1B on the platform.
On today’s episode of “Sh*t-You-Only-See-In-Crypto-And-Hollywood-Movies”… a Binance executive has escaped custody and fled Nigeria. Nadeem Anjarwalla had been in custody since late February but recently escaped after “guards had escorted him to a nearby mosque” to pray.
The SEC is reportedly seeking $2B in fines and penalties from Ripple Labs. And I thought my $30 parking ticket the other day was bad…
Final words:
Altcoins looking weak with possible push down. BTC need to push stronger up.
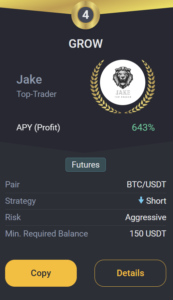
GROW BOT UPDATE:
Copy trade GROW 0.1->10k$ since 18.03.23 we got +219.0% PROFIT!
GROW CURENTLY:
TRADING COIN: BTC/USDT
SETUP: SHORT
TAKE PROFIT: /
SAFETY ORDERS: /
Liquidation: /
Not Financial Advice!
Good luck with trades,
JAKE