Altcoins show strength and will push up.
Jake
TOP Trader
BTC:
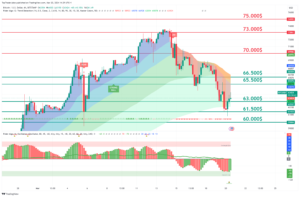
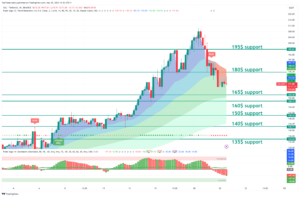
INTRO: BTC retesting 64.000$ as resistance.
Technical analysis for the BTC/USDT chart:
Key Levels:
- Resistance: $65.000,$65.500
- Support: $62,000, $63,000
Strategy:
- Long: Buy at $60,100 with a stop loss below $58,000 and a target price of $69,000.
- Short: Sell at $65,000 with a stop loss above $67,500 and a target price of $60,000.
Range Description:
BTC/USDT is currently trading in a range between $60,000 and $65,000. The pair has broken into this range during the day. However, there are signs that the pair is ready to make a move with a possible retest of support.
On the upside, BTC/USDT is facing resistance at $63,000. The $63,000 level has been tested today, and if the price holds above it on the daily close, it will be confirmed as support. A break above $63,000 would signal a bullish breakout and could send the pair higher to $65,000.
On the downside, BTC/USDT is facing support at $62,500. This level was a previous resistance for the day and is now holding as support. A break below $62,500 would signal a bearish breakdown and could send the pair lower to $58,000 or even $50,000.
BTC1D chart TW: https://www.tradingview.com/x/AAW8VED7/
ETH:
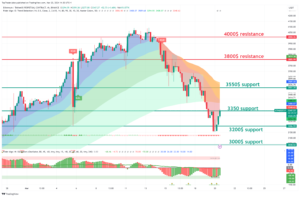
INTRO: ETH retesting 3200$ support.
Here is a technical analysis of the ETH/USDT chart:
Key Levels:
- Resistance: $3300, $3500
- Support: $3200, $3000
Strategy:
- Long: Buy at $3200 with a stop loss below $3000 and a target price of $4000.
- Short: Sell at $3300 with a stop loss above $3500 and a target price of $3000.
Range Description:
ETH/USDT is currently trading in a range between $3,000 and $3,300. The pair has broken into this range during the day. However, there are signs that the pair is ready to make a move with a possible retest of support.
On the upside, ETH/USDT is facing resistance at $3,300. This level hasn’t been tested today, and if the price holds above it on the daily close, it will be confirmed as support. A break above $3,300 would signal a bullish breakout and could send the pair higher to $3,500.
On the downside, ETH/USDT is facing support at $3,200. This level is a previous swing low and has been tested multiple times in recent weeks as resistance. A break below $3,200 would signal a bearish breakdown and could send the pair lower to $3,000 or even $2,800.
ETH1D chart TW link: https://www.tradingview.com/x/AAW8VED7/
XRP:
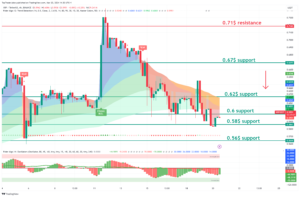
INTRO: XRP retesting 0.58$ support.
Here is a technical analysis of the XRP/USDT chart:
Key Levels:
- Resistance: $0.70, $0.67
- Support: $0.62, $0.64
Strategy:
- Long: Buy at $0.67 with a stop loss below $0.62 and a target price of $0.78.
- Short: Sell at $0.72 with a stop loss above $0.74 and a target price of $0.62.
Range Description:
XRP/USDT is currently trading in a range between $0.62 and $0.72. The pair has shifted into this range during the day. However, there are signs that the pair is ready to make a move with a possible retest of support.
On the upside, XRP/USDT is facing resistance at $0.70. This level has been tested today, and if the price holds above it on the daily close, it will be confirmed as support. A break above $0.70 would signal a bullish breakout and could send the pair higher to $0.72.
On the downside, XRP/USDT is facing support at $0.67. This level is a previous swing low and has been tested multiple times in recent weeks as significant support. A break below $0.67 would signal a bearish breakdown and could send the pair lower to $0.62 or even $0.60.
XRP chart TW link: https://www.tradingview.com/x/gSi9e3BI/
LINK:
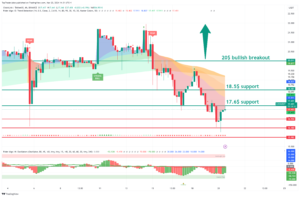
INTRO: LINK retest support at 17.5$.
Here is a technical analysis for the LINK/USDT chart:
Key Levels:
- Resistance: $20
- Support: $17.6
Strategy:
- Long: Buy at $17.6 with a stop loss below $17 and a target price of $20.
- Short: Sell at $20 with a stop loss above $21 and a target price of $17.6.
Range Description:
LINK/USDT is currently trading in a range between $17 and $20. The pair has shifted into this range during the day. However, there are signs that the pair is ready to make a move with a possible retest of support.
On the upside, LINK/USDT is facing resistance at $20. This level has been tested today, and if the price holds above it on the daily close, it will be confirmed as support. A break above $20 would signal a bullish breakout and could send the pair higher to $22.
On the downside, LINK/USDT is facing support at $17.6. This level is a previous swing low and has been tested multiple times in recent weeks as significant resistance. A break below $17.6 would signal a bearish breakdown and could send the pair lower to $17 or even $16.
LINK chart TW link: https://www.tradingview.com/x/gSi9e3BI/
SOL:
INTRO: SOL retest 165$ support.
Here is a technical analysis of the SOL/USDT chart:
Key Levels:
- Resistance: $135, $126
- Support: $120, 107$
Strategy:
- Long: Buy at $120 with a stop loss below $100 and a target price of $130.
- Short: Sell at $100 with a stop loss above $ 107 and a target price of $90.
Range Description:
SOL/USDT is currently trading in a range between $120 and $140. However, there are signs that the pair is ready to make a move to push against strong resistance at $150.
On the upside, SOL/USDT is facing resistance at $135. This level has been tested today, and if the price holds above it on the daily close, it will be confirmed as support. A break above $135 would signal a bullish breakout and could send the pair higher to $150.
On the downside, SOL/USDT is facing support at $120. This level is a previous swing low and has been tested multiple times in recent weeks as significant support. A break below $120 would signal a bearish breakdown and could send the pair lower to $100 or even $90.
SOL chart TW link: https://www.tradingview.com/x/Y19Td0p7/
CRYPTO NEWS:
3 QUESTIONS TO ASK WHEN PRICES CRASH
It’s been a bloody 7 days for crypto…
- Major cryptocurrencies (BTC, ETH) are down 10% or more.
- Altcoins dropped 20%-30%.
- NFT floor prices plummeted 10%-30%.
- Popular memecoins crashed 30%-40%.
My my… how the tables have turned.
These big price corrections can be scary. But they’re also great moments to step back and ask some questions.
Here are the 3 we always ask ourselves when prices drop:
1/ Did my belief change? Or just the price?
For example, let’s look at tech stocks (just hear me out).
Google, Amazon, and Facebook are some of the best businesses ever invented. Yet each of them has seen huge price drops at some point over the last few years (i.e. Facebook dropped 70% in 2022).
Does that mean Facebook was 70% less valuable that year? No.
As the billionaire Dharmesh Shah says: “Valuation oscillates up and down around value.”
So while value and valuation are related, they are not the same.
Ok, now back to crypto. We believe the industry has created a ton of value. It’s a new financial system with superior alternatives to gold, currencies, stock exchanges, and savings accounts.
That’s still true whether BTC is at $73K or $50K.
2/ Am I a tourist? Or a local?
When prices are up, crypto gets more tourists than Miami during Spring Break.
Then when the weather gets bad (aka prices drop), they all leave.
Locals know that seasons change and know how to live with the weather cycles.
3/ Is crypto crashing? Or is everything on sale?
This is one of my favorite crypto memes…
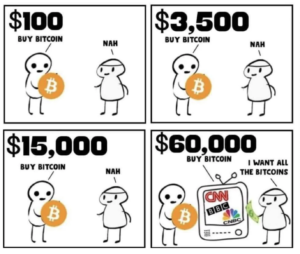
It’s funny AND has a lot of truth to it:
- When prices are pumping, we wish we had bought more at lower prices.
- When prices are dumping, we get too scared to buy and shrivel into the fetal position.
Most investors panic during price corrections. The great ones view them as fire sales.
FAST NEWS:
Japan’s state pension fund (GPIF) is exploring BTC as a potential investment to diversify its portfolio. Fun fact: GPIF is the world’s largest pension fund.
Changpeng Zhao is launching a new online education platform called ‘Giggle Academy’. The former Binance CEO says it will be a “gamified, adaptive” platform that aims to provide free basic education for all.
Fidelity amended its spot ETH ETF application to include staking. According to the filing, staking “may be treated as income to the Fund as compensation for services provided.”
Centrifuge launched a new on-chain fund management platform. The goal? To connect all service providers and data into a central control panel to automate reporting, streamline fund operations, and improve transparency for investors.
OKX will be delisting trading pairs with Tether’s stablecoin in Europe. Users based in the European Union (EU) and the European Economic Area (EEA) will no longer be able to trade using USDT pairs.
Final words:
Market need to break strong resistance and push strongly up.
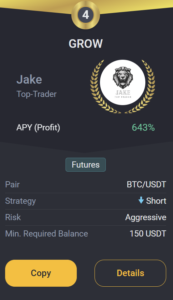
GROW BOT UPDATE:
Copy trade GROW 0.1->10k$ since 18.03.23 we got +219.0% PROFIT!
GROW CURENTLY:
TRADING COIN: BTC/USDT
SETUP: SHORT
TAKE PROFIT: /
SAFETY ORDERS: /
Liquidation: /
Not Financial Advice!
Good luck with trades,
JAKE