

Altcoins losing momentum and hitting support.
Jake
TOP Trader
BTC:
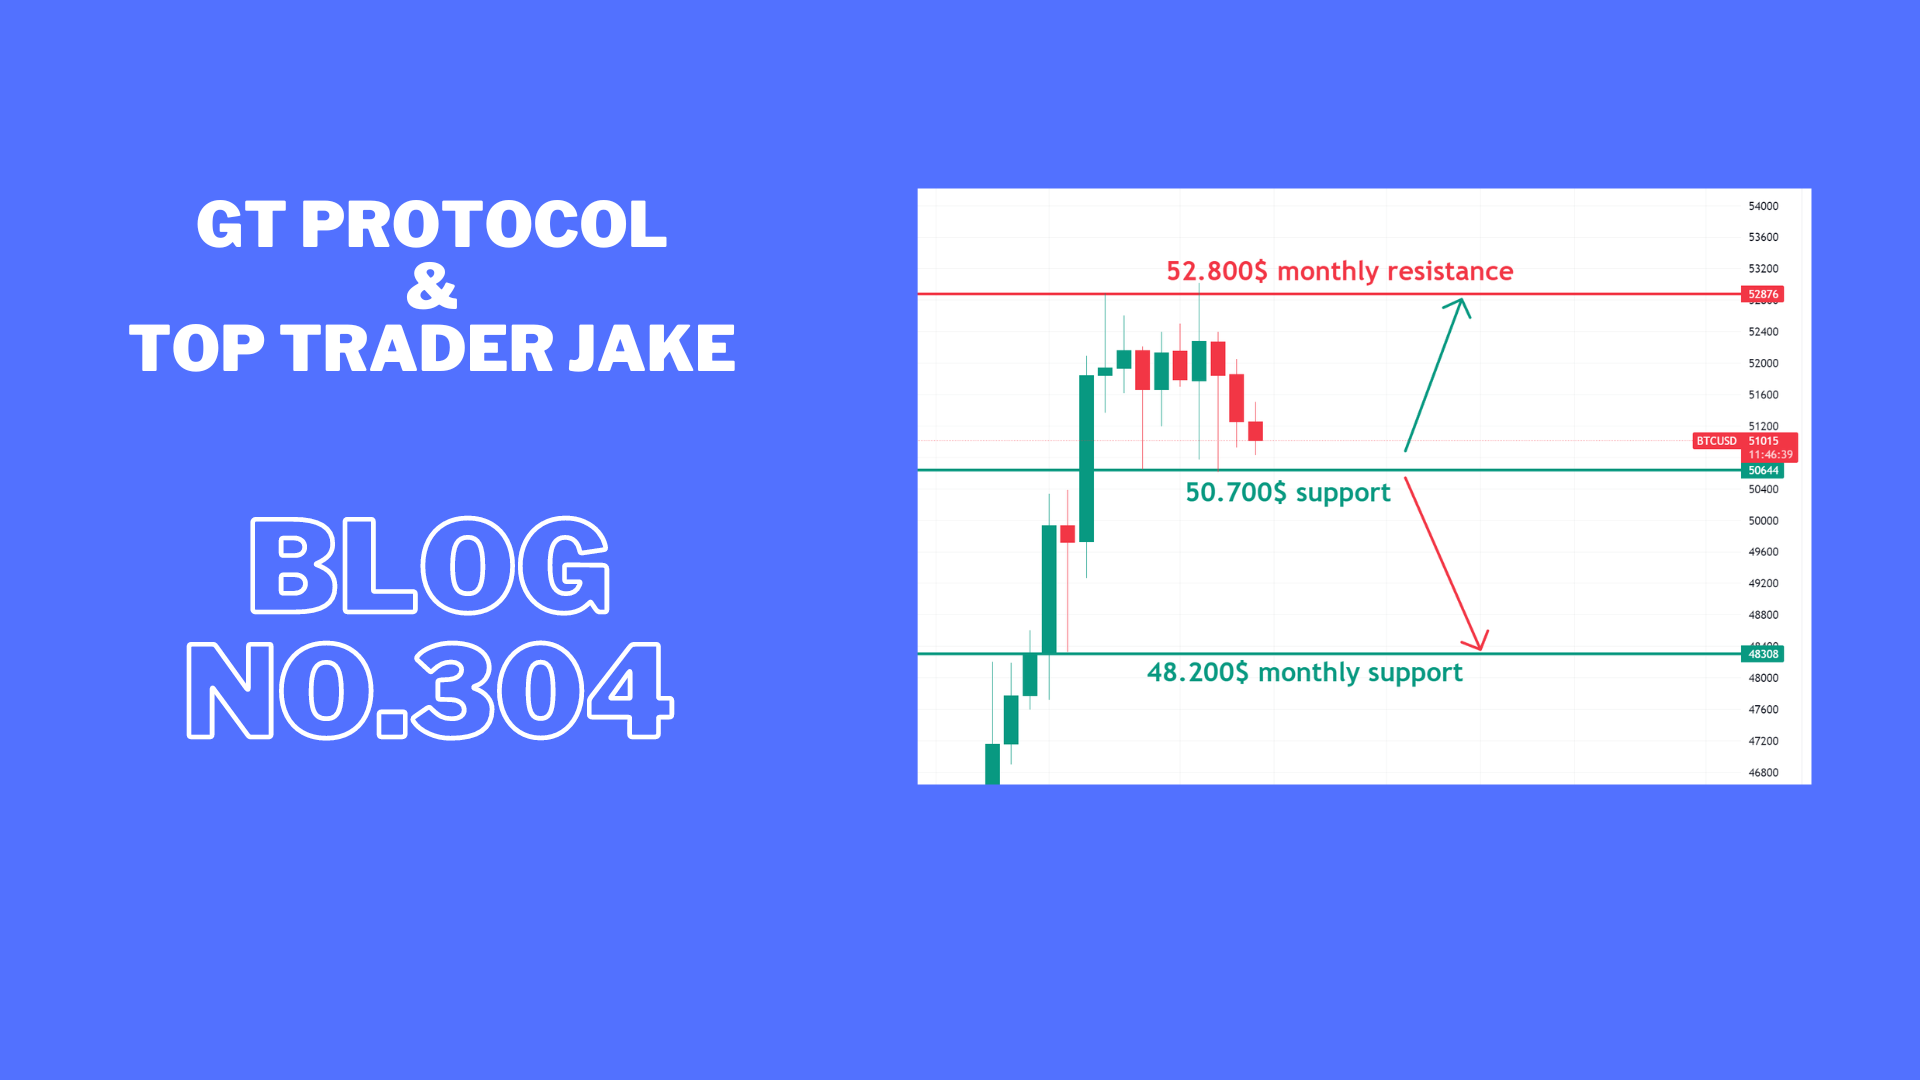
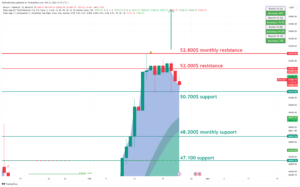
INTRO: BTC retesting 52k resistance.
Technical analysis for the BTC/USDT chart:
Key Levels:
- Resistance: $52,800, $52,000
- Support: $50,000, $48,200
Strategy:
- Long: Buy at $50,100 with a stop loss below $48,000 and a target price of $52,000.
- Short: Sell at $52,000 with a stop loss above $53,500 and a target price of $47,000.
Range Description:
BTC/USDT is currently trading in a range between $47,000 and $52,000. The pair has broken into the range during the day. However, there are signs that the pair is ready to make a move with a possible retest of support.
On the upside, BTC/USDT is facing resistance at $50,000. The $50,000 level has been tested today, and if the price holds above it on the daily close, it will be confirmed as support. A break above $50,000 would signal a bullish breakout and could send the pair higher to $52,000.
On the downside, BTC/USDT is facing support at $48,500. This level was a previous resistance for the day and now holds as support. A break below $48,500 would signal a bearish breakdown and could send the pair lower to $45,000 or even $42,000.
BTC1D chart TW link: https://www.tradingview.com/x/lmdKgdhv/
ETH:
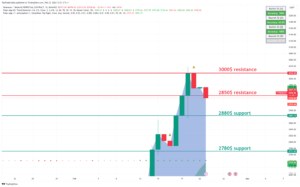
INTRO: ETH consolidating under 3000$.
Here is a technical analysis of the ETH/USDT chart:
Key Levels:
- Resistance: $3000, $2850
- Support: $2515, $2780
Strategy:
- Long: Buy at $2780 with a stop loss below $2400 and a target price of $3000.
- Short: Sell at $3000 with a stop loss above $3100 and a target price of $2800.
Range Description:
ETH/USDT is currently trading in a range between $2800 and $3000. The pair has broken into the range during the day. However, there are signs that the pair is ready to make a move with a possible retest of support.
On the upside, ETH/USDT is facing resistance at $2780. This level hasn’t been tested today, and if the price holds above it on the daily close, it will be confirmed as support. A break above $2780 would signal a bullish breakout and could send the pair higher to $3000.
On the downside, ETH/USDT is facing support at $2515. This level is a previous swing low and has been tested multiple times in recent weeks as resistance. A break below $2515 would signal a bearish breakdown and could send the pair lower to $2300 or even $2200.
ETH1D chart TW link: https://www.tradingview.com/x/avpjOqfC/
XRP:
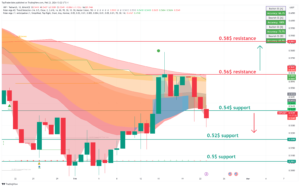
INTRO: XRP testing 0.54$ support.
Here is a technical analysis of the XRP/USDT chart:
Key Levels:
- Resistance: $0.50, $0.52
- Support: $0.48, $0.46
Strategy:
- Long: Buy at $0.48 with a stop loss below $0.46 and a target price of $0.58.
- Short: Sell at $0.50 with a stop loss above $0.52 and a target price of $0.46.
Range Description:
XRP/USDT is currently trading in a range between $0.48 and $0.52. The pair has shifted into the range during the day. However, there are signs that the pair is ready to make a move with a possible retest of support.
On the upside, XRP/USDT is facing resistance at $0.50. This level has been tested today, and if the price holds above it on the daily close, it will be confirmed as support. A break above $0.50 would signal a bullish breakout and could send the pair higher to $0.52.
On the downside, XRP/USDT is facing support at $0.48. This level is a previous swing low and has been tested multiple times in recent weeks as significant support. A break below $0.48 would signal a bearish breakdown and could send the pair lower to $0.46 or even $0.44.
XRP chart TW link: https://www.tradingview.com/x/ApuWTDVW/
LINK:
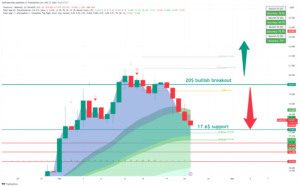
INTRO: LINK retesting 18$ support.
Here is a technical analysis for the LINK/USDT chart:
Key Levels:
- Resistance: $20
- Support: $17.6
Strategy:
- Long: Buy at $17.6 with a stop loss below $17 and a target price of $20.
- Short: Sell at $20 with a stop loss above $21 and a target price of $17.6.
Range Description:
LINK/USDT is currently trading in a range between $17 and $20. The pair has shifted into the range during the day. However, there are signs that the pair is ready to make a move with a possible retest of support.
On the upside, LINK/USDT is facing resistance at $20. This level has been tested today, and if the price holds above it on the daily close, it will be confirmed as support. A break above $20 would signal a bullish breakout and could send the pair higher to $22.
On the downside, LINK/USDT is facing support at $17.6. This level is a previous swing low and has been tested multiple times in recent weeks as significant resistance. A break below $17.6 would signal a bearish breakdown and could send the pair lower to $17 or even $16.
LINK chart TW link: https://www.tradingview.com/x/Fl8wLYjn/
SOL:
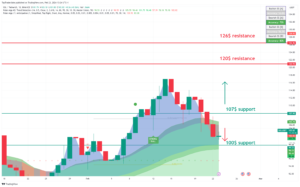
INTRO: SOL retesting 100$ support.
Here is a technical analysis of the SOL/USDT chart:
Key Levels:
- Resistance: $100, $107
- Support: $79, 90$
Strategy:
- Long: Buy at $90 with a stop loss below $75 and a target price of $100.
- Short: Sell at $100 with a stop loss above $ 107 and a target price of $90.
Range Description:
SOL/USDT is currently trading in a range between $75 and $100. However, there are signs that the pair is ready to make a move to push strong resistance at $90.
On the upside, SOL/USDT is facing resistance at $100. This level has been tested today, and if the price holds above it on the daily close, it will be confirmed as support. A break above $100 would signal a bullish breakout and could send the pair higher to $107.
On the downside, SOL/USDT is facing support at $90. This level is a previous swing low and has been tested multiple times in recent weeks as significant support. A break below $90 would signal a bearish breakdown and could send the pair lower to $70 or even $60.
SOL chart TW link: https://www.tradingview.com/x/pw9Y8p1X/
CRYPTO NEWS:
GRAPH OF THE DAY: BTC IS A 4-YEAR BET
Here’s a crazy stat for you…
During a 4-year investment period, BTC has NEVER had annualized returns under 30%. No matter how badly timed the investment was.
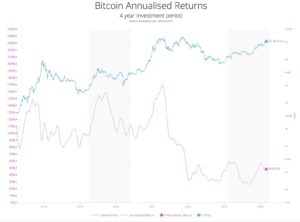
Now here’s how that 4-year investment period stacks up with other assets (s/o to Willy Woo for the data):
- BTC: 30-60% annualized returns.
- SP500: 10% annualized returns.
- Real Estate: 10% annualized returns.
BTC is in a league of its own.
P.S. – Let me tell you a quick story related to this…
The year was 2020. The world was locked down. It was chaos.
The good news? Our bank accounts had just been injected with a $1,200 stimmy (aka stimulus checks).
Some people use the money for business (i.e. pay rent, bills, etc.).
Others used the money for pleasure (i.e. shopping sprees, DoorDash, etc.).
But I had one friend who did something different… he invested his $1,200 into BTC.
Fast forward to today (~4 years later), and that investment is worth $9,230.
That’s a +669% return.
Crazy, I know. I used my $1,200 to turn DoorDash into my chef and all I got in return was 20 pounds of “love padding” in my midsection.
The big takeaway: If you’re willing to ride the Bitcoin rollercoaster for 4 years straight, the ticket pays for itself – and then some.
FAST NEWS:
Sports Illustrated is migrating its NFT service, Box Office, to the Avalanche blockchain. Box Office is a blockchain-based ticketing service that individuals can use to set up paid or free events.
Wormhole is teaming up with AMD to develop zero-knowledge infrastructure. The semiconductor manufacturer will provide Wormhole with hardware and advice to grow its interoperability app.
Arbitrum Foundation is financing a new feature-length film called “New Here.” It will explore the world of digital art and will be produced by Oscar-winner Shane Boris.
South Korea’s top crypto custodian saw deposits triple in the second half of 2023. The main catalyst? Bitcoin ETFs (many are expecting South Korea to launch a spot Bitcoin ETF soon).
Do Kwon will be extradited to the U.S. They should make him do a Walk of Shame like in Game of Thrones.
Final words:
Altcoins are bleeding and we could see bigger push down.
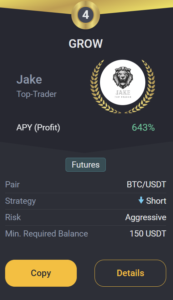
GROW BOT UPDATE:
Copy trade GROW 0.1->10k$ since 18.03.23 we got +219.0% PROFIT!
GROW CURENTLY:
TRADING COIN: BTC/USDT
SETUP: SHORT
TAKE PROFIT: /
SAFETY ORDERS: /
Liquidation: /
Not Financial Advice!
Good luck with trades,
JAKE