

Resistance still holds strong and a bigger buy volume could push the market up.
Jake
TOP Trader
BTC:
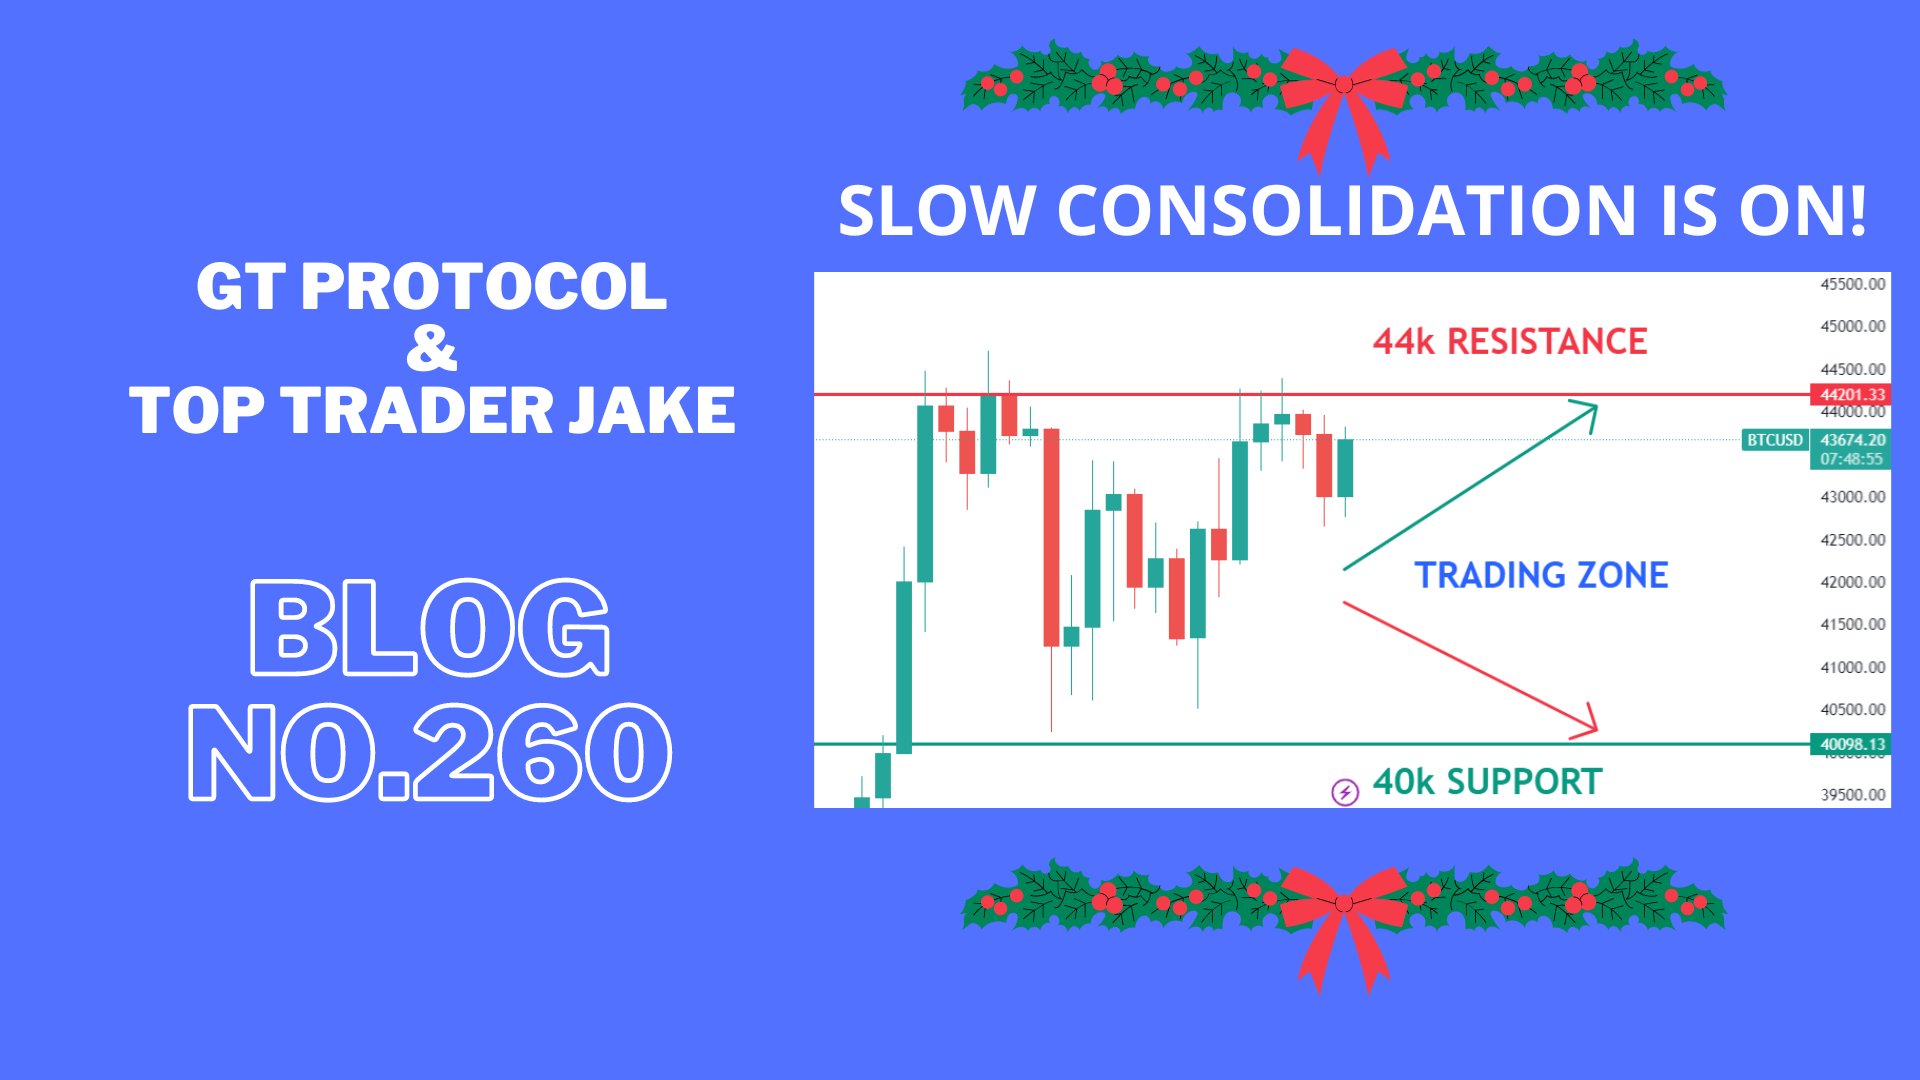
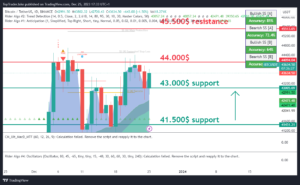
INTRO: BTC pushing 44k strong resistance.
Technical analysis for the BTC/USDT chart:
Key Levels:
• Resistance: $45,500, $44,000
• Support: $43,000, $41,500
Strategy:
• Long: Buy at $43.000 with a stop loss below $40,000 and a target price of $45,500.
• Short: Sell at $44,000 with a stop loss above $45,500 and a target price of $40,000.
Range Description:
BTC/USDT is currently trading in a range between $40,500 and $44,000. The pair has broken into range during the day. However, there are signs that the pair is ready to make a move with possible retest of support.
On the upside, BTC/USDT is facing resistance at $44,000. And 43,000$ level has been tested today and if the price holds above on the daily close it will be confirmed as support. A break above $43,000 would signal a bullish breakout and could send the pair higher to $45,500.
On the downside, BTC/USDT is facing support at $41,500. This level is a previous resistance for the day and now holds as support. A break below $40,000 would signal a bearish breakdown, sending the pair lower to $37,000 or even $35,000.
BTC1D chart TW link: https://www.tradingview.com/x/jcxwXJ8o/
ETH:
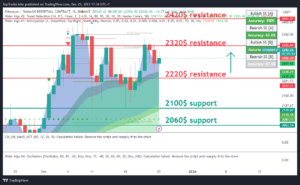
INTRO: ETH breaks 2220$ as strong resistance and continues to push up.
Here is a technical analysis of the ETH/USDT chart:
Key Levels:
• Resistance: $2320, $2220
• Support: $2060, $2100
Strategy:
• Long: Buy at $2220 with a stop loss below $2060 and a target price of $2320.
• Short: Sell at $2220 with a stop loss above $2320 and a target price of $2100.
Range Description:
ETH/USDT is currently trading in a range between $2100 and $2400. The pair has broken into range during the day. However, there are signs that the pair is ready to make a move with possible retest of support.
On the upside, ETH/USDT is facing resistance at $2220. This level wasn’t tested today and if the price holds above on the daily close it will be confirmed as support. A break above $2220 would signal a bullish breakout and could send the pair higher to $2320.
On the downside, ETH/USDT is facing support at $2100. This level is a previous swing low and has been tested multiple times in recent weeks as resistance. A break below $2100 would signal a bearish breakdown and could send the pair lower to $2000 or even $1900.
ETH1D chart TW link: https://www.tradingview.com/x/DHnMrtW0/
XRP:
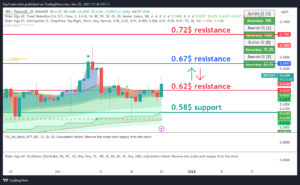
INTRO: XRP trying to break the 0.62$ resistance for bullish continuation.
Here is a technical analysis of the XRP/USDT chart:
Key Levels:
• Resistance: $0.62, $0.67
• Support: $0.58, $0.54
Strategy:
• Long: Buy at $0.62 with a stop loss below $0.58 and a target price of $0.67.
• Short: Sell at $0.62 with a stop loss above $0.67 and a target price of $0.58.
Range Description:
XRP/USDT is currently trading in a range between $0.58 and $0.67. The pair has shifted into range during the day. However, there are signs that the pair is ready to make a move with possible retest of support.
On the upside, XRP/USDT is facing resistance at $0.66. This level has been tested today and if the price holds above on the daily close it will be confirmed as support. A break above $0.67 would signal a bullish breakout and could send the pair higher to $0.7.
On the downside, XRP/USDT is facing support at $0.62. This level is a previous swing low and has been tested multiple times in recent weeks as big support. A break below $0.62 would signal a bearish breakdown and could send the pair lower to $0.58 or even $0.54.
XRP chart TW link: https://www.tradingview.com/x/p4C3admw/
LINK:
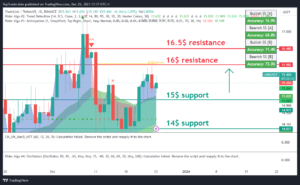
INTRO: LINK breaks strong resistance at 15$ and continues to push.
Here is a technical analysis for the LINK/USDT chart:
Key Levels:
• Resistance: $16, $16.5
• Support: $15, $14
Strategy:
• Long: Buy at $14 with a stop loss below $13.3 and a target price of $16.
• Short: Sell at $16 with a stop loss above $17.5 and a target price of $14.
Range Description:
LINK/USDT is currently trading in a range between $14 and $16. The pair has shifted into range during the day. However, there are signs that the pair is ready to make a move with possible retest of support.
On the upside, LINK/USDT is facing resistance at $15. This level has been tested today and if the price holds above on the daily close it will be confirmed as support. A break above $15 would signal a bullish breakout and could send the pair higher to $17.
On the downside, LINK/USDT is facing support at $14. This level is a previous swing low and has been tested multiple times in recent weeks as big resistance. A break below $14 would signal a bearish breakdown and could send the pair lower to $13 or even $14.
LINK chart TW link: https://www.tradingview.com/x/xD9asEl2/
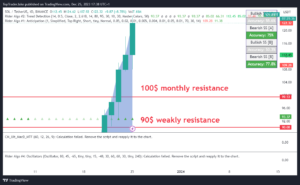
SOL:
INTRO: SOL pushing fully into the bullish breakout.
Here is a technical analysis of the SOL/USDT chart:
Key Levels:
• Resistance: $90, $100
• Support: $75, $79
Strategy:
• Long: Buy at $79 with a stop loss below $75 and a target price of $90.
• Short: Sell at $90 with a stop loss above $100 and a target price of $79.
Range Description:
SOL/USDT is currently trading in a range between 79$ and 90$. However, there are signs that the pair is ready to make a move to push strong resistance at 90$.
On the upside, SOL/USDT is facing resistance at $90. This level it has been tested today and if the price holds above on the daily close it will be confirmed as support. A break above $90 would signal a bullish breakout and could send the pair higher to $100.
On the downside, SOL/USDT is facing support at $79. This level is a previous swing low and has been tested multiple times in recent weeks as big support. A break below $79 would signal a bearish breakdown and could send the pair lower to $75 or even $70.
SOL chart TW link: https://www.tradingview.com/x/a5igwjpw/
CRYPTO NEWS:
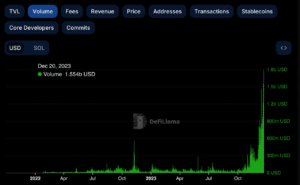
SOLANA’S DEX VOLUME 100X’D IN 3 MONTHS
Here’s a wild stat for ya…
• Solana’s DEX trading volume on Sept. 22… $13.24M.
• Solana’s DEX trading volume on Dec. 20…$1.55B. (as in B, for billions!!)
That’s 100x growth in 3 months.
OK! WE SEE YOU SOLANA!
FROM $52 —> $100K+
Every once in a while, you’ll come across a crypto trade that’ll make you do a double take…
You’ll start questioning whether laws were broken in the process…
Well, check out this trade from $52 → $112,000.
How? Black magic A new memecoin, DogWifHat ($WIF).
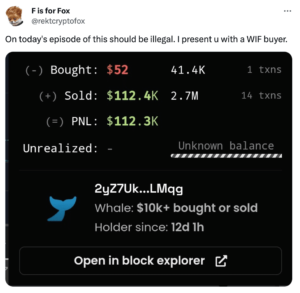
P.S. – we have no idea who this is… but damnit, we’re still cheering them on like an NBA fan that just hit a half-court shot to win a brand new car!
FAST NEWS:
• DEX transaction volumes on Solana have overtaken those of Ethereum for the first time, thanks to meme coin mania and the network’s lower gas fees.
• Solana itself surged by double digits on Thursday, propelled by canine-themed meme coins including BONK and Dogwifhat.
• Teneo, the firm handling the liquidation of Three Arrows Capital, has frozen around $1.4 billion worth of 3AC assets, preventing the bankrupt hedge fund’s co-founders from accessing the funds.
Final words:
Happy holidays for all traders slowing in volume and trading is expected for the coming days.
We celebrate 1 year of blog posting by Top Trader Jake we are happy to announce that we have upgraded the BLOG post with more information and trading setups!
Please send us a message about what coin would you like to see in Trader Jake Technical Analysis we are ready to add more coins and setups.
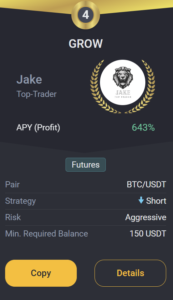
GROW BOT UPDATE:
Copy trade GROW 0.1->10k$ since 18.03 we got +176.0% PROFIT!
GROW CURRENTLY:
TRADING COIN: BTC/USDT
SETUP: SHORT
TAKE PROFIT: 43.000 USDT
SAFETY ORDERS: 3/10
Liquidation: 57,000 USDT
Not Financial Advice!
Good luck with trades,
JAKE