

The market is waiting for news on ETFs and is consolidating under resistance, waiting for a strong push up or down.
Jake
TOP Trader
BTC:
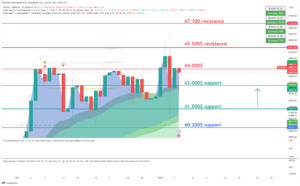
INTRO: BTC holds the line at the 43k level.
Technical analysis for the BTC/USDT chart:
Key Levels:
- Resistance: $45,500, $44,000
- Support: $43,000, $41,500
Strategy:
- Long: Buy at $43.000 with a stop loss below $40,000 and a target price of $45,500.
- Short: Sell at $44,000 with a stop loss above $45,500 and a target price of $40,000.
Range description:
BTC/USDT is currently trading in a range between $40,500 and $45,000. The pair has broken into the range during the day. However, there are signs that the pair is ready to make a move with a possible retest of support.
On the upside, BTC/USDT is facing resistance at $44,000. The $43,000 level has been tested today, and if the price holds above on the daily close, it will be confirmed as support. A break above $43,000 would signal a bullish breakout and could send the pair higher to $45,500.
On the downside, BTC/USDT is facing support at $41,500. This level was a previous resistance for the day and now holds as support. A break below $40,000 would signal a bearish breakdown and could send the pair lower to $37,000 or even $35,000.
BTC1D chart TW link: https://www.tradingview.com/x/vYObKTpQ/
ETH:
INTRO: ETH has returned to the $2,200 support zone.
Here is a technical analysis for the ETH/USDT chart:
Key Levels:
- Resistance: $2320, $2420
- Support: $2220, $2100
Strategy:
- Long: Buy at $2220 with a stop loss below $2100 and a target price of $2420.
- Short: Sell at $2420 with a stop loss above $2520 and a target price of $2100.
Range description:
ETH/USDT is currently trading in a range between $2100 and $2400. The pair has broken into the range during the day. However, there are signs that the pair is ready to make a move with a possible retest of support.
On the upside, ETH/USDT is facing resistance at $2420. This level hasn’t been tested today, and if the price holds above on the daily close, it will be confirmed as support. A break above $2420 would signal a bullish breakout and could send the pair higher to $2520.
On the downside, ETH/USDT is facing support at $2320. This level is a previous swing low and has been tested multiple times in recent weeks as resistance. A break below $2320 would signal a bearish breakdown and could send the pair lower to $2220 or even $2000.
ETH1D chart TW link: https://www.tradingview.com/x/fymiR89a/
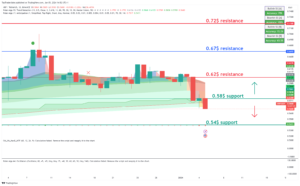
XRP:
INTRO: XRP clears all longs to $0.5 and pushes back from there.
Here is a technical analysis for the XRP/USDT chart:
Key Levels:
- Resistance: $0.62, $0.67
- Support: $0.58, $0.54
Strategy:
- Long: Buy at $0.62 with a stop loss below $0.58 and a target price of $0.67.
- Short: Sell at $0.62 with a stop loss above $0.67 and a target price of $0.58.
Range description:
XRP/USDT is currently trading in a range between $0.58 and $0.67. The pair has shifted into the range during the day. However, there are signs that the pair is ready to make a move with a possible retest of support.
On the upside, XRP/USDT is facing resistance at $0.66. This level has been tested today, and if the price holds above on the daily close, it will be confirmed as support. A break above $0.67 would signal a bullish breakout and could send the pair higher to $0.7.
On the downside, XRP/USDT is facing support at $0.62. This level is a previous swing low and has been tested multiple times in recent weeks as significant support. A break below $0.62 would signal a bearish breakdown and could send the pair lower to $0.58 or even $0.54.
XRP chart TW link: https://www.tradingview.com/x/bZ1latib/
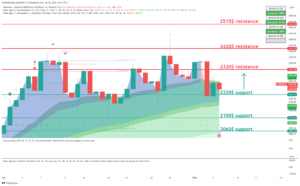
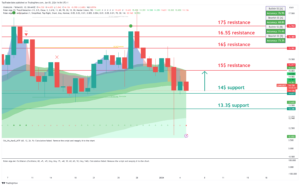
LINK:
INTRO: LINK returns to the $12 range.
Here is a technical analysis for the LINK/USDT chart:
Key Levels:
- Resistance: $15, $16
- Support: $13.3, $14
Strategy:
- Long: Buy at $14 with a stop loss below $13 and a target price of $16.
- Short: Sell at $15 with a stop loss above $16 and a target price of $14.
Range description:
LINK/USDT is currently trading in a range between $14 and $17. The pair has shifted into the range during the day. However, there are signs that the pair is ready to make a move with a possible retest of support.
On the upside, LINK/USDT is facing resistance at $15. This level has been tested today, and if the price holds above on the daily close, it will be confirmed as support. A break above $15 would signal a bullish breakout and could send the pair higher to $16.
On the downside, LINK/USDT is facing support at $14. This level is a previous swing low and has been tested multiple times in recent weeks as significant resistance. A break below $14 would signal a bearish breakdown and could send the pair lower to $13 or even $12.
LINK chart TW link: https://www.tradingview.com/x/x4j7nuwo/
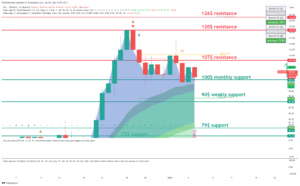
SOL:
INTRO: SOL is back in the $100 zone.
Here is a technical analysis for the SOL/USDT chart:
Key Levels:
- Resistance: $107, $120
- Support: $90, 100$
Strategy:
- Long: Buy at $100 with a stop loss below $90 and a target price of $120.
- Short: Sell at $107 with a stop loss above $120 and a target price of $100.
Range description:
SOL/USDT is currently trading in a range between $100 and $126. However, there are signs that the pair is ready to make a move to push strong resistance at $120.
On the upside, SOL/USDT is facing resistance at $107. This level has been tested today, and if the price holds above on the daily close, it will be confirmed as support. A break above $107 would signal a bullish breakout and could send the pair higher to $126.
On the downside, SOL/USDT is facing support at $100. This level is a previous swing low and has been tested multiple times in recent weeks as significant support. A break below $100 would signal a bearish breakdown and could send the pair lower to $90 or even $80.
SOL chart TW link: https://www.tradingview.com/x/IWsGZRbD/
CRYPTO NEWS:
WHAT HAPPENED WITH PUMP?
What a start to the year, huh?
We’re 3 days in and crypto’s already gone through the whole “we’re back → it’s so over” cycle…

So, what happened? A mix of two things…
1/ An article predicting all Bitcoin ETFs would get denied went viral.
Matrixport (a crypto financial services platform) published a report about Bitcoin ETFs earlier this week. This was the headline…
![]()
A day later, they published another report. Except this time, Matrixport was changing up the tune like it was a T-Pain hit single…
?I can put you in a mansion, somewhere in Wiscaansin ?
(Side note: T-Pain’s the only guy who could pull off changing Wisconsin to “Wiscaansin” and still make a banger).
Anyway, here was Matrixport’s headline yesterday:
![]()
Hmmm… from “approval imminent” → “REJECTED” within 24 hours.
No sources. No juicy insider info. Just one analyst’s opinion. But it was enough to send fear, uncertainty, and doubt throughout crypto.
Some people think this could be one of the reasons prices started dropping. And to make things worse…
2/ Overleveraged investors got liquidated.
Over the last few weeks, the crypto market has seen more green than a text chat between two Android users. And when investors see green, they get greedy.
Now, take that greed, sprinkle some FOMO (Fear Of Missing Out), and what do you get…? A crypto degenerate ready to risk it all.
And these risk-loving, FOMO-injected investors would leverage their first-born kid to get more money to buy crypto if they could.
Unfortunately, or luckily, they can’t.
So they turn to leverage trading, or borrowing money, to maximize gains.
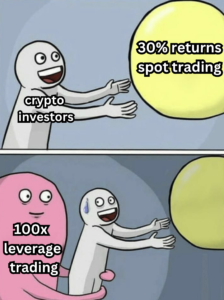
Big leverage (50x-100x) can lead to big gains. But when prices drop, they turn into big pains.
- Leveraged positions get liquidated, bringing prices down.
- Other investors see prices drop. They panic and start selling their assets.
- Prices go lower and more leveraged positions get liquidated.
Suddenly… it turns into a “flash crash”. And at one point yesterday, $480M was liquidated within a single hour.
I repeat. $480M. Gone in 60 minutes.
Trader Jake Take: Flash crashes happen all the time in crypto. They suck, but they’re necessary.
They flush out all the crap (i.e., greedy, over-leveraged traders) and help reset the markets.
It’s like when you pump your body with too much late-night McDonald’s. You know that eventually, that dump is coming.
We’re long-term believers anyway, so no need to panic. We’ll just keep calm and HODL on.
FAST NEWS:
Michael Saylor plans to sell $216 million worth of MicroStrategy shares to buy more BTC. There are three certainties in life: death, taxes, and Michael Saylor buying more Bitcoin.
Goldman Sachs eyes an authorized partner role for multiple Bitcoin ETFs. Goldman Sachs’s involvement would aid high-profile BTC ETF bids from BlackRock and Grayscale.
The U.S. government now holds more than $8 billion in Bitcoin. Thanks to the recent pump, the U.S. government’s holdings are up from $5 billion less than three months ago.
Etherscan acquires Solscan to expand blockchain data services. Etherscan plans to integrate useful features across both Etherscan and Solscan.
Final words:
Market still waiting for ETF news so better take no trades until news come out.
ETFs are still in danger and big news manipulation could make swift moves in crypto.
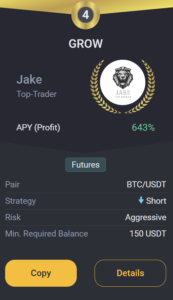
GROW BOT UPDATE:
Copy trade GROW 0.1->10k$ since 18.03 we got +214.0% PROFIT!
GROW CURENTLY:
TRADING COIN: BTC/USDT
SETUP: SHORT
TAKE PROFIT: /
SAFETY ORDERS: /
Liquidation: /
Not Financial Advice!
Good luck with trades,
JAKE