

Altcoins are preparing for a new upward spurt and SOL, having overcome all resistances, will continue to move in the coming days.
Jake
TOP Trader
BTC:
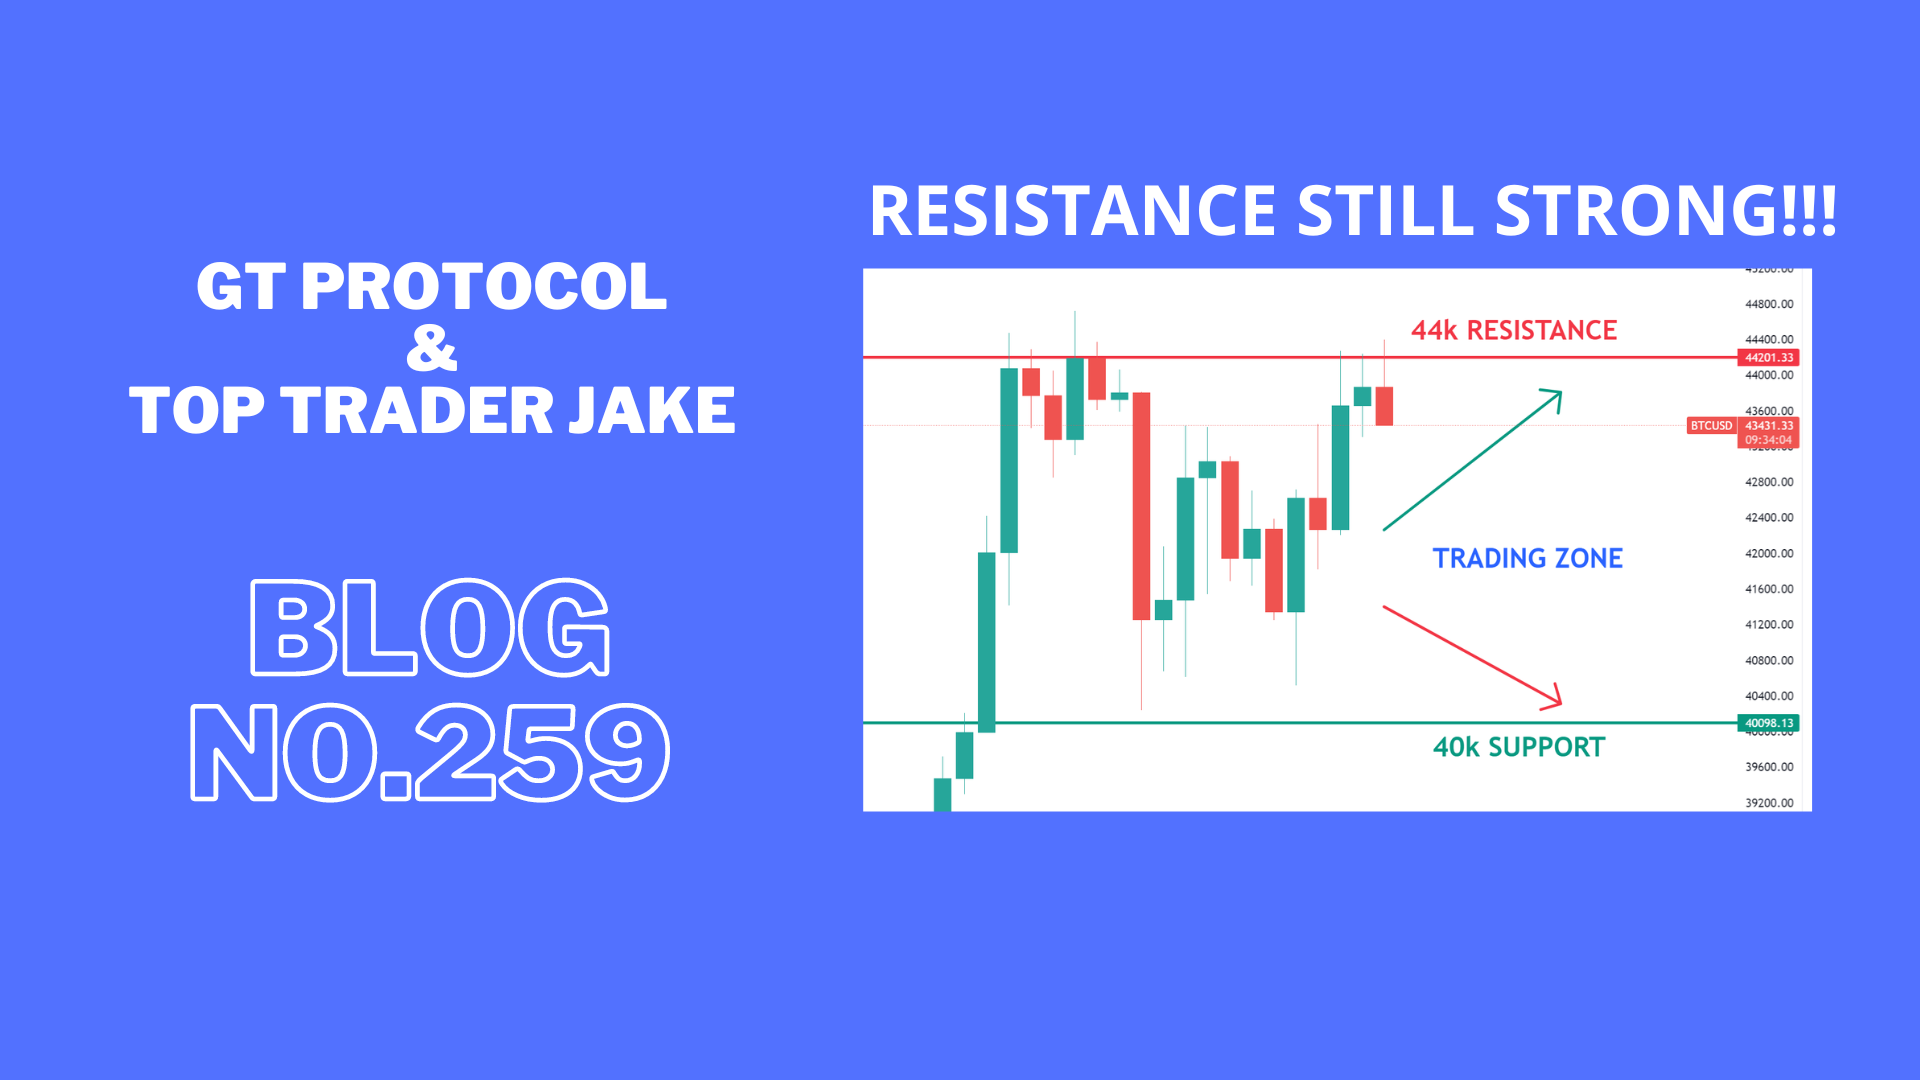
INTRO: BTC is pushing 44k – strong resistance.
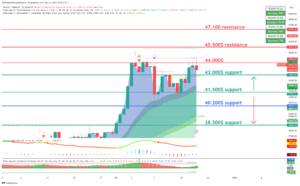
Technical analysis for the BTC/USDT chart:
Key Levels:
- Resistance: $45,500, $44,000
- Support: $43,000, $41,500
Strategy:
- Long: Buy at $43.000 with a stop loss below $40,000 and a target price of $45,500.
- Short: Sell at $44,000 with a stop loss above $45,500 and a target price of $40,000.
Range description:
BTC/USDT is currently trading in a range between $40,500 and $44,000. The pair has broken into the range during the day. However, there are signs that the pair is ready to make a move with a possible retest of support.
On the upside, BTC/USDT is facing resistance at $44,000, and the $43,000 level has been tested today. If the price holds above it on the daily close, it will be confirmed as support. A break above $43,000 would signal a bullish breakout and could send the pair higher to $45,500.
On the downside, BTC/USDT is facing support at $41,500. This level was a previous resistance for the day and is now holding as support. A break below $40,000 would signal a bearish breakdown and could send the pair lower to $37,000 or even $35,000.
BTC1D chart TW link: https://www.tradingview.com/x/X6yYqjsb/
ETH:
INTRO: ETH breaks through $2,220 as strong resistance and continues to push upwards.
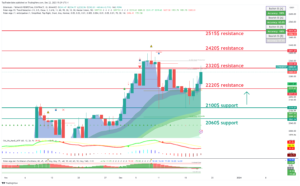
Here is a technical analysis for the ETH/USDT chart:
Key Levels:
- Resistance: $2320, $2220
- Support: $2060, $2100
Strategy:
- Long: Buy at $2220 with a stop loss below $2060 and a target price of $2320.
- Short: Sell at $2220 with a stop loss above $2320 and a target price of $2100.
Range description:
ETH/USDT is currently trading in a range between $2,100 and $2,400. The pair has broken into the range during the day. However, there are signs that the pair is ready to make a move with a possible retest of support.
On the upside, ETH/USDT is facing resistance at $2,220. This level hasn’t been tested today, and if the price holds above it on the daily close, it will be confirmed as support. A break above $2,220 would signal a bullish breakout and could send the pair higher to $2,320.
On the downside, ETH/USDT is facing support at $2,100. This level is a previous swing low and has been tested multiple times in recent weeks as resistance. A break below $2,100 would signal a bearish breakdown and could send the pair lower to $2,000 or even $1,900.
ETH1D chart TW link: https://www.tradingview.com/x/VB21AeQB/
XRP:
INTRO: XRP is trying to break through the $0.62 resistance to continue the bullish move.
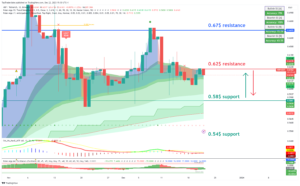
Here is a technical analysis for the XRP/USDT chart:
Key Levels:
- Resistance: $0.62, $0.67
- Support: $0.58, $0.54
Strategy:
- Long: Buy at $0.62 with a stop loss below $0.58 and a target price of $0.67.
- Short: Sell at $0.62 with a stop loss above $0.67 and a target price of $0.58.
Range description:
XRP/USDT is currently trading in a range between $0.58 and $0.67. The pair has shifted into the range during the day. However, there are signs that the pair is ready to make a move with a possible retest of support.
On the upside, XRP/USDT is facing resistance at $0.66. This level has been tested today, and if the price holds above it on the daily close, it will be confirmed as support. A break above $0.67 would signal a bullish breakout and could send the pair higher to $0.7.
On the downside, XRP/USDT is facing support at $0.62. This level is a previous swing low and has been tested multiple times in recent weeks as significant support. A break below $0.62 would signal a bearish breakdown and could send the pair lower to $0.58 or even $0.54.
XRP chart TW link: https://www.tradingview.com/x/a3QrIbwq/
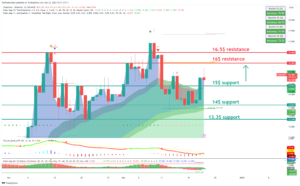
LINK:
INTRO: LINK breaks strong resistance at the $15 level and continues to move.
Here is a technical analysis for the LINK/USDT chart:
Key Levels:
- Resistance: $16, $16.5
- Support: $15, $14
Strategy:
- Long: Buy at $14 with a stop loss below $13.3 and a target price of $16.
- Short: Sell at $16 with a stop loss above $17.5 and a target price of $14.
Range description:
LINK/USDT is currently trading in a range between $14 and $16. The pair has shifted into the range during the day. However, there are signs that the pair is ready to make a move with a possible retest of support.
On the upside, LINK/USDT is facing resistance at $15. This level has been tested today, and if the price holds above it on the daily close, it will be confirmed as support. A break above $15 would signal a bullish breakout and could send the pair higher to $17.
On the downside, LINK/USDT is facing support at $14. This level is a previous swing low and has been tested multiple times in recent weeks as significant resistance. A break below $14 would signal a bearish breakdown and could send the pair lower to $13 or even $14.
LINK chart TW link: https://www.tradingview.com/x/62zC7aTa/
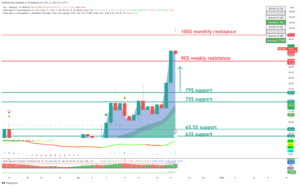
SOL:
INTRO: SOL is pushing hard and breaking through resistance in the form of a full bullish breakout.
Here is a technical analysis for the SOL/USDT chart:
Key Levels:
- Resistance: $90, $100
- Support: $75, $79
Strategy:
- Long: Buy at $79 with a stop loss below $75 and a target price of $90.
- Short: Sell at $90 with a stop loss above $100 and a target price of $79.
Range description:
SOL/USDT is currently trading in a range between $79 and $90. However, there are signs that the pair is ready to make a move to push strong resistance at $90.
On the upside, SOL/USDT is facing resistance at $90. This level has been tested today, and if the price holds above it on the daily close, it will be confirmed as support. A break above $90 would signal a bullish breakout and could send the pair higher to $100.
On the downside, SOL/USDT is facing support at $79. This level is a previous swing low and has been tested multiple times in recent weeks as significant support. A break below $79 would signal a bearish breakdown and could send the pair lower to $75 or even $70.
SOL chart TW link: https://www.tradingview.com/x/qkUDxRHz/
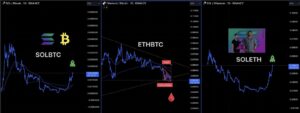
CRYPTO NEWS:
ETH TRADING PAIRS ARE DOWN, SOL TRADING PAIRS ARE UP
In a bull market, most tokens experience significant gains.
It’s like that episode of Oprah… ‘You get a price pump! You get a price pump! Everyone gets a price pump!’
But not all gains are created equally; some jump by 50%, others by 100%.
This is why it’s essential to track how assets perform relative to each other.
But not all gains are created equally; some jump by 50%, others by 100%.
This is why it’s essential to track how assets perform relative to each other.
That’s where trading pairs come in. They denominate the price of one cryptocurrency in the value of another cryptocurrency rather than just U.S. dollars.
Well, check it out… here’s how some popular trading pairs are performing recently:
- ETH/BTC: -30% and bleeding ?
- SOL/BTC: +260% year-to-date and pumping ?
- SOL/ETH: +410% and pumping ?
FAST NEWS:
Coinbase secured a virtual asset service provider (VASP) license in France. This will allow the crypto exchange to offer various crypto asset activities in France, such as custody, trading, and payments.
Circle received conditional registration to provide digital asset services in France. Coinbase and Circle in one day. Nice. I guess France was running a 2-for-1 special on crypto licenses.
MoonPay launched a new checkout tool to easily buy NFTs using credit and debit cards. It’s a no-code tool that can be easily added to websites, allowing customers to purchase NFTs across dozens of chains using debit and credit cards.
Final words:
Big swings are expected before end of year so take care of your trades it could move strongly in both direction.
WE celebrate 1 year of blog posting by Top Trader Jake we are happy to announce that we upgrade BLOG post with more information and trading setups!
Please send us message what coin would you like to see in Trader Jake Technical Analysis we are ready to add more coins and setups.
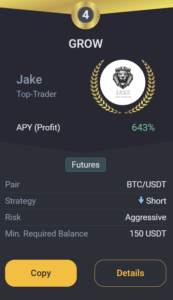
GROW BOT UPDATE:
Copy trade GROW 0.1->10k$ since 18.03 we got +176.0% PROFIT!
GROW CURENTLY:
TRADING COIN: BTC/USDT
SETUP: SHORT
TAKE PROFIT: 43.000 USDT
SAFETY ORDERS: 3/10
Liquidation: 57,000 USDT
Not Financial Advice!
Good luck with trades,
JAKE