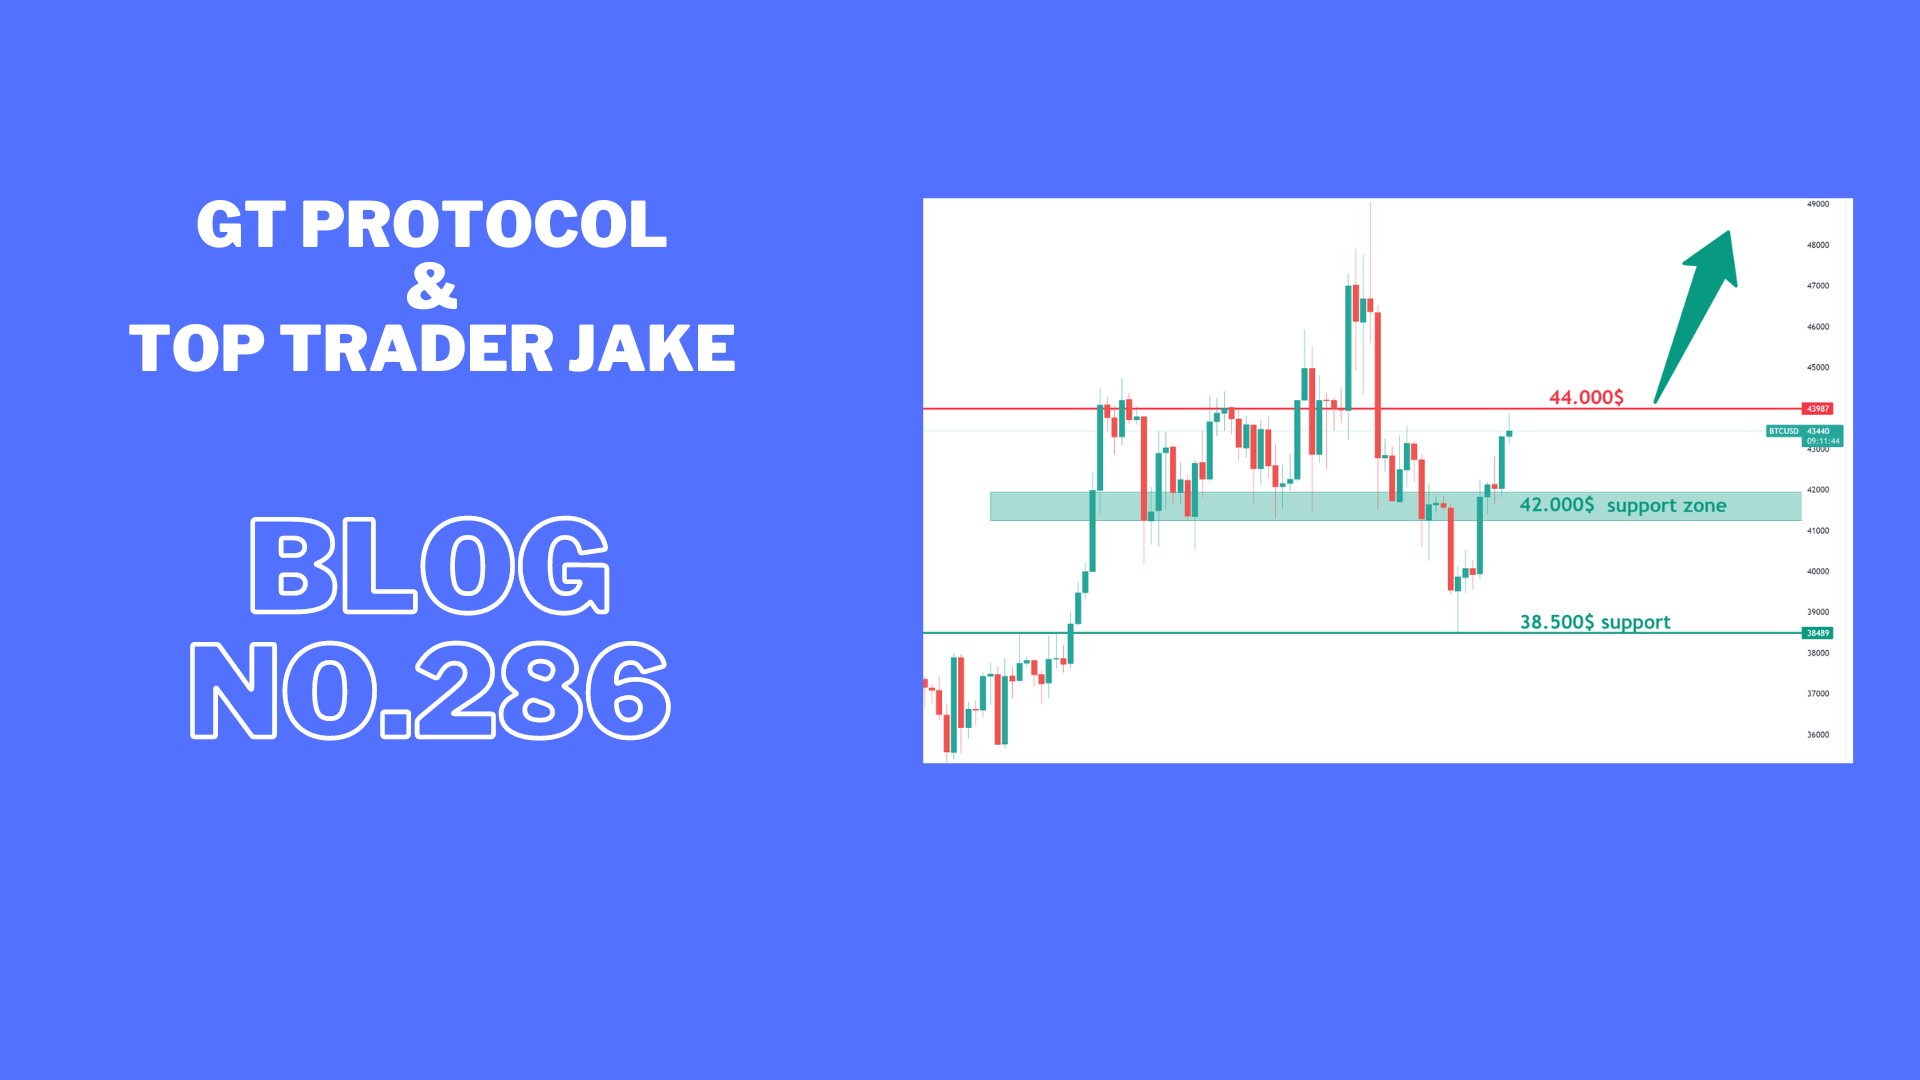


BTC and altcoins are breaking resistance and pushing up strongly.
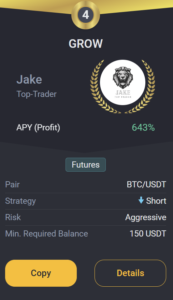
Jake
TOP Trader
BTC:
INTRO: BTC pushing resistance at 44k.
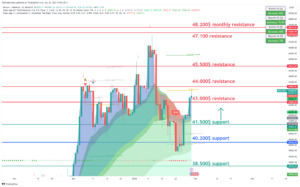
Technical analysis for the BTC/USDT chart:
Key Levels:
- Resistance: $44,000, $43,000
- Support: $41,500, $40,200
Strategy:
- Long: Buy at $41,500 with a stop loss below $40,000 and a target price of $44,000.
- Short: Sell at $43,000 with a stop loss above $44,500 and a target price of $40,200.
Range Description:
BTC/USDT is currently trading in a range between $38,500 and $42,000. The pair has broken into the range during the day. However, there are signs that the pair is ready to make a move with a possible retest of support.
On the upside, BTC/USDT is facing resistance at $43,000. The $43,000 level has been tested today, and if the price holds above it on the daily close, it will be confirmed as support. A break above $43,000 would signal a bullish breakout and could send the pair higher to $45,000.
On the downside, BTC/USDT is facing support at $41,500. This level was a previous resistance for the day and now holds as support. A break below $41,500 would signal a bearish breakdown and could send the pair lower to $40,000 or even $39,000.
BTC1D chart TW link: https://www.tradingview.com/x/x6wqpEib/
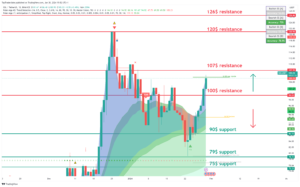
ETH:
INTRO: ETH testing support at 2200$.
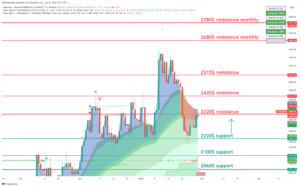
Here is a technical analysis of the ETH/USDT chart:
Key Levels:
- Resistance: $2320, $2420
- Support: $2220, $2100
Strategy:
- Long: Buy at $2220 with a stop loss below $2100 and a target price of $2320.
- Short: Sell at $2320 with a stop loss above $2420 and a target price of $2200.
Range Description:
ETH/USDT is currently trading in a range between $2200 and $2500. The pair has broken into the range during the day. However, there are signs that the pair is ready to make a move with a possible retest of support.
On the upside, ETH/USDT is facing resistance at $2320. This level hasn’t been tested today, and if the price holds above it on the daily close, it will be confirmed as support. A break above $2320 would signal a bullish breakout and could send the pair higher to $2320.
On the downside, ETH/USDT is facing support at $2220. This level is a previous swing low and has been tested multiple times in recent weeks as resistance. A break below $2220 would signal a bearish breakdown and could send the pair lower to $2120 or even $2000.
ETH1D chart TW link: https://www.tradingview.com/x/EBf8kYWw/
XRP:
INTRO: XRP holding above 0.5$ and needs to hold before the big nuke.
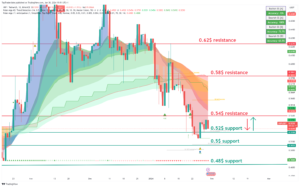
Here is a technical analysis of the XRP/USDT chart:
Key Levels:
- Resistance: $0.54, $0.58
- Support: $0.5, $0.52
Strategy:
- Long: Buy at $0.5 with a stop loss below $0.48 and a target price of $0.58.
- Short: Sell at $0.54 with a stop loss above $0.58 and a target price of $0.5.
Range Description:
XRP/USDT is currently trading in a range between $0.5 and $0.54. The pair has shifted into range during the day. However, there are signs that the pair is ready to make a move with a possible retest of support.
On the upside, XRP/USDT is facing resistance at $0.54. This level has been tested today, and if the price holds above the daily close, it will be confirmed as support. A break above $0.54 would signal a bullish breakout and could send the pair higher to $0.58.
On the downside, XRP/USDT is facing support at $0.5. This level is a previous swing low and has been tested multiple times in recent weeks as significant support. A break below $0.5 would signal a bearish breakdown and could send the pair lower to $0.48 or even $0.46.
XRP chart TW link: https://www.tradingview.com/x/7Z1nW6Ny/
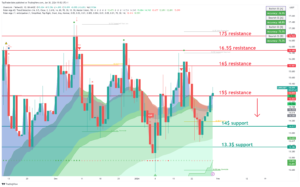
LINK:
INTRO: LINK pushing high above 15$ resistance.
Here is a technical analysis for the LINK/USDT chart:
Key Levels:
- Resistance: $15, $16
- Support: $13.3, $14
Strategy:
- Long: Buy at $14 with a stop loss below $13 and a target price of $16.
- Short: Sell at $15 with a stop loss above $16.5 and a target price of $14.
Range Description:
LINK/USDT is currently trading in a range between $14 and $16. The pair has shifted into range during the day. However, there are signs that the pair is ready to make a move with a possible retest of support.
On the upside, LINK/USDT is facing resistance at $15. This level has been tested today, and if the price holds above the daily close, it will be confirmed as support. A break above $15 would signal a bullish breakout and could send the pair higher to $17.
On the downside, LINK/USDT is facing support at $14. This level is a previous swing low and has been tested multiple times in recent weeks as significant resistance. A break below $14 would signal a bearish breakdown and could send the pair lower to $13 or even $12.
LINK chart TW link: https://www.tradingview.com/x/gk8Usetv/
SOL:
INTRO: SOL fighting with 100$ resistance.
Here is a technical analysis of the SOL/USDT chart:
Key Levels:
- Resistance: $100, $107
- Support: $79, 90$
Strategy:
- Long: Buy at $90 with a stop loss below $75 and a target price of $100.
- Short: Sell at $100 with a stop loss above $ 107 and a target price of $90.
Range Description:
SOL/USDT is currently trading in a range between $75 and $100. However, there are signs that the pair is ready to make a move to push strong resistance at $90.
On the upside, SOL/USDT is facing resistance at $100. This level has been tested today, and if the price holds above the daily close, it will be confirmed as support. A break above $100 would signal a bullish breakout and could send the pair higher to $107.
On the downside, SOL/USDT is facing support at $90. This level is a previous swing low and has been tested multiple times in recent weeks as significant support. A break below $90 would signal a bearish breakdown and could send the pair lower to $70 or even $60.
SOL chart TW link: https://www.tradingview.com/x/SnqaICic/
CRYPTO NEWS:
THE #1 THING TO AVOID IN CRYPTO
You’ll see a lot of acronyms flying around crypto…
- TVL (total value locked).
- MAU (monthly active users).
- DAA (daily active addresses).
These are all common metrics investors use to decide whether a crypto project is “legit” or not. You’ll hear things like…
“This project has more TVL, so it’s better!”
“Just look at the trading volume; this is the next big thing!”
But oftentimes, this is a trap. And one you want to avoid.
Why? First things first… a lot of these metrics are inflated.
Here are two examples:
1/ Solana’s stablecoin volume. Solana has recently led all chains in stablecoin volume.
It saw ~$120B in USDC volume last week alone. Sounds impressive, right?
Well, a Twitter user (@CarryWorm) decided to dig deeper. Here’s what they found…
- 90% of the volume was coming from the same 9 accounts.
- All of them were market makers.
- They inflated the numbers by creating and canceling orders that were never filled.
In other words, Solana’s stablecoin volume has more hot air than a bag of Cheetos.
2/ NFT lending on Blur. NFT lending (also known as “NFTfi”) has been one of the hotter narratives in crypto.
Blur has been leading the way.
$833M in NFT loans has been given out or refinanced on its platform this month alone.
Well, NFTstats.eth (NFT guru and friend of Milk Road) recently found out that:
- 2 wallets account for $230M of the loans.
- That makes up 55.9% of all volume.

Trader Jake Take: Try to avoid the Metrics-Mania of Crypto…
- Don’t get hypnotized by high numbers. Just like a magician’s trick, the real action is often where you’re not looking.
- Look for substance over sparkle. It’s easy to get caught up in the razzle-dazzle of big stats, but the devil’s in the details.
- Always DYOR (do your own research). Dig deeper, question more, and remember… not all that is counted truly counts.
FAST NEWS:
The Bahamut Grants Program has launched, featuring a $10 million $FTN fund for individuals, businesses, organizations, and researchers. The Bahamut chain is an innovative, EVM-based, layer 1 public blockchain with smart contract capabilities, advanced security, and a unique PoSA consensus – that means Proof of Stake and Activity!*
OpenSea’s CEO states that the NFT platform is “open-minded” towards acquisitions. “The honest answer is that we take a pretty open-minded approach. We think that if the right partnership comes along, then that’s something we should certainly consider.” —DL News
A dark web dealer surrenders $340 million in crypto under a new plea deal, marking the largest crypto seizure in the Drug Enforcement Agency’s (DEA) history.
Bloomberg experts believe there is a 60% chance an ETF will be approved in May. James Seyffart (ETF guru) is eyeing May 23 as the next date to watch in the spot ether saga.
Analysts predict that Charles Schwab will eventually offer its own Bitcoin ETF. Some experts speculate that Schwab’s delay may allow the firm to offer lower fees than its competitors.
A poem inscribed on the Bitcoin blockchain sold for $11,430 at Sotheby’s. It’s the first-ever individual poem sold by the 280-year-old auction house.
Final words:
Market make move and now altcoins need to push strongly up above resistance.
GROW BOT UPDATE:
Copy trade GROW 0.1->10k$ since 18.03.23 we got +219.0% PROFIT!
GROW CURENTLY:
TRADING COIN: BTC/USDT
SETUP: SHORT
TAKE PROFIT: /
SAFETY ORDERS: /
Liquidation: /
Not Financial Advice!
Good luck with trades,
JAKE