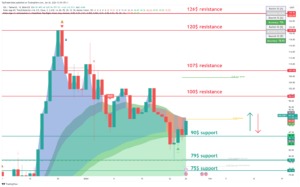
BTC is pumping back to the channel and hitting strong resistance at 42k$.
Jake
TOP Trader
BTC:
INTRO: BTC pushing resistance at 42k.
Technical analysis for the BTC/USDT chart:
Key Levels:
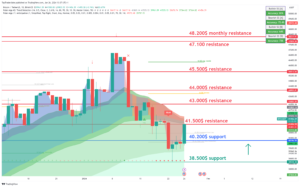
- Resistance: $41,500, $43,000
- Support: $38,500, $40,200
Strategy:
- Long: Buy at $38,500 with a stop loss below $37,000 and a target price of $41,000.
- Short: Sell at $41,500 with a stop loss above $42,500 and a target price of $40,200.
Range Description:
BTC/USDT is currently trading between $38,500 and $42,000. The pair has broken into the range during the day. However, there are signs that the pair is ready to make a move with a possible retest of support.
On the upside, BTC/USDT faces resistance at $41,500, and the $41,500 level has been tested today. If the price holds above it on the daily close, it will be confirmed as support. A break above $41,500 would signal a bullish breakout and could send the pair higher to $43,000.
On the downside, BTC/USDT is facing support at $40,200. This level was a previous resistance for the day and now holds as support. A break below $40,200 would signal a bearish breakdown, sending the pair lower to $38,000 or even $37,000.
BTC1D chart TW link: https://www.tradingview.com/x/4O2WzI16/
ETH:
INTRO: ETH testing support at 2200$.
Here is a technical analysis of the ETH/USDT chart:
Key Levels:
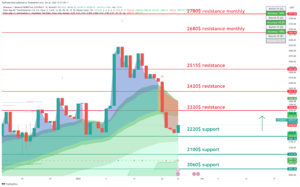
- Resistance: $2320, $2420
- Support: $2220, $2100
Strategy:
- Long: Buy at $2220 with a stop loss below $2100 and a target price of $2320.
- Short: Sell at $2320 with a stop loss above $2420 and a target price of $2200.
Range Description:
ETH/USDT is currently trading between $2200 and $2500. The pair has broken into the range during the day. However, there are signs that the pair is ready to make a move with a possible retest of support.
On the upside, ETH/USDT is facing resistance at $2320. This level hasn’t been tested today, and if the price holds above it on the daily close, it will be confirmed as support. A break above $2320 would signal a bullish breakout and could send the pair higher to $2520.
On the downside, ETH/USDT is facing support at $2220. This level is a previous swing low and has been tested multiple times in recent weeks as resistance. A break below $2220 would signal a bearish breakdown and could send the pair lower to $2120 or even $2000.
ETH1D chart TW link: https://www.tradingview.com/x/4O2WzI16/
XRP:
INTRO: XRP holding above 0.5$ and needs to hold before the big nuke.
Here is a technical analysis of the XRP/USDT chart:
Key Levels:
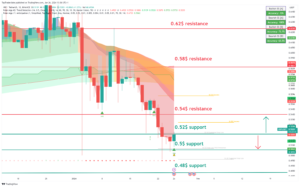
- Resistance: $0.54, $0.58
- Support: $0.5, $0.52
Strategy:
- Long: Buy at $0.5 with a stop loss below $0.48 and a target price of $0.58.
- Short: Sell at $0.54 with a stop loss above $0.58 and a target price of $0.5.
Range Description:
XRP/USDT is currently trading between $0.5 and $0.54. The pair has shifted into the range during the day. However, there are signs that the pair is ready to make a move with a possible retest of support.
On the upside, XRP/USDT is facing resistance at $0.54. This level has been tested today, and if the price holds above it on the daily close, it will be confirmed as support. A break above $0.54 would signal a bullish breakout and could send the pair higher to $0.58.
On the downside, XRP/USDT is facing support at $0.5. This level is a previous swing low and has been tested multiple times in recent weeks as significant support. A break below $0.5 would signal a bearish breakdown and could send the pair lower to $0.48 or even $0.46.
XRP chart TW link: https://www.tradingview.com/x/r9cQQ1fE/
LINK:
INTRO: LINK pushing high above 15$ resistance.
Here is a technical analysis for the LINK/USDT chart:
Key Levels:
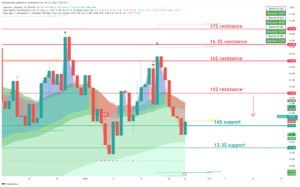
- Resistance: $15, $16
- Support: $13.3, $14
Strategy:
- Long: Buy at $14 with a stop loss below $13 and a target price of $16.
- Short: Sell at $15 with a stop loss above $16.5 and a target price of $14.
Range Description:
LINK/USDT is currently trading between $14 and $16. The pair has shifted into the range during the day. However, there are signs that the pair is ready to make a move with a possible retest of support.
On the upside, LINK/USDT is facing resistance at $15. This level has been tested today, and if the price holds above it on the daily close, it will be confirmed as support. A break above $15 would signal a bullish breakout and could send the pair higher to $17.
On the downside, LINK/USDT is facing support at $14. This level is a previous swing low and has been tested multiple times in recent weeks as significant resistance. A break below $14 would signal a bearish breakdown and could send the pair lower to $13 or even $12.
LINK chart TW link: https://www.tradingview.com/x/hetSYqAE/
SOL:
INTRO: SOL fighting with 100$ resistance.
Here is a technical analysis of the SOL/USDT chart:
Key Levels:
- Resistance: $100, $107
- Support: $79, 90$
Strategy:
- Long: Buy at $90 with a stop loss below $75 and a target price of $100.
- Short: Sell at $100 with a stop loss above $ 107 and a target price of $90.
Range Description:
SOL/USDT is currently trading in a range between $75 and $100. However, there are signs that the pair is ready to make a move to push strong resistance at $90.
On the upside, SOL/USDT is facing resistance at $100. This level has been tested today, and if the price holds above it on the daily close, it will be confirmed as support. A break above $100 would signal a bullish breakout and could send the pair higher to $107.
On the downside, SOL/USDT is facing support at $90. This level is a previous swing low and has been tested multiple times in recent weeks as significant support. A break below $90 would signal a bearish breakdown and could send the pair lower to $70 or even $60.
SOL chart TW link: https://www.tradingview.com/x/uvxyNSZP/
CRYPTO NEWS:
HOW MUCH MONEY DO BITCOIN MINERS MAKE?
Mining Bitcoin is a lucrative business.
How lucrative? Bitcoin miners are averaging $12.3 billion in annual revenue.
(Alexa, play “Make It Rain”)
Here’s how Bitcoin mining revenue stacks up:
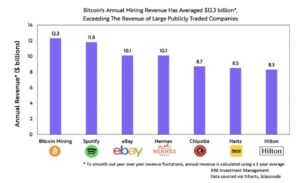
Pretty crazy. Bitcoin mining was once considered a “side hobby for nerds”…
Now it makes more money than some of the largest companies in the world!
FAST NEWS:
Final words:
Market pushing back from sell news event and now need to hold above.
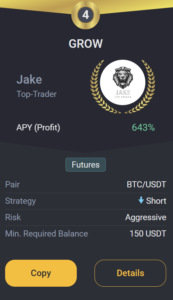
GROW BOT UPDATE:
Copy trade GROW 0.1->10k$ since 18.03.23 we got +219.0% PROFIT!
GROW CURENTLY:
TRADING COIN: BTC/USDT
SETUP: SHORT
TAKE PROFIT: /
SAFETY ORDERS: /
Liquidation: /
Not Financial Advice!
Good luck with trades,
JAKE