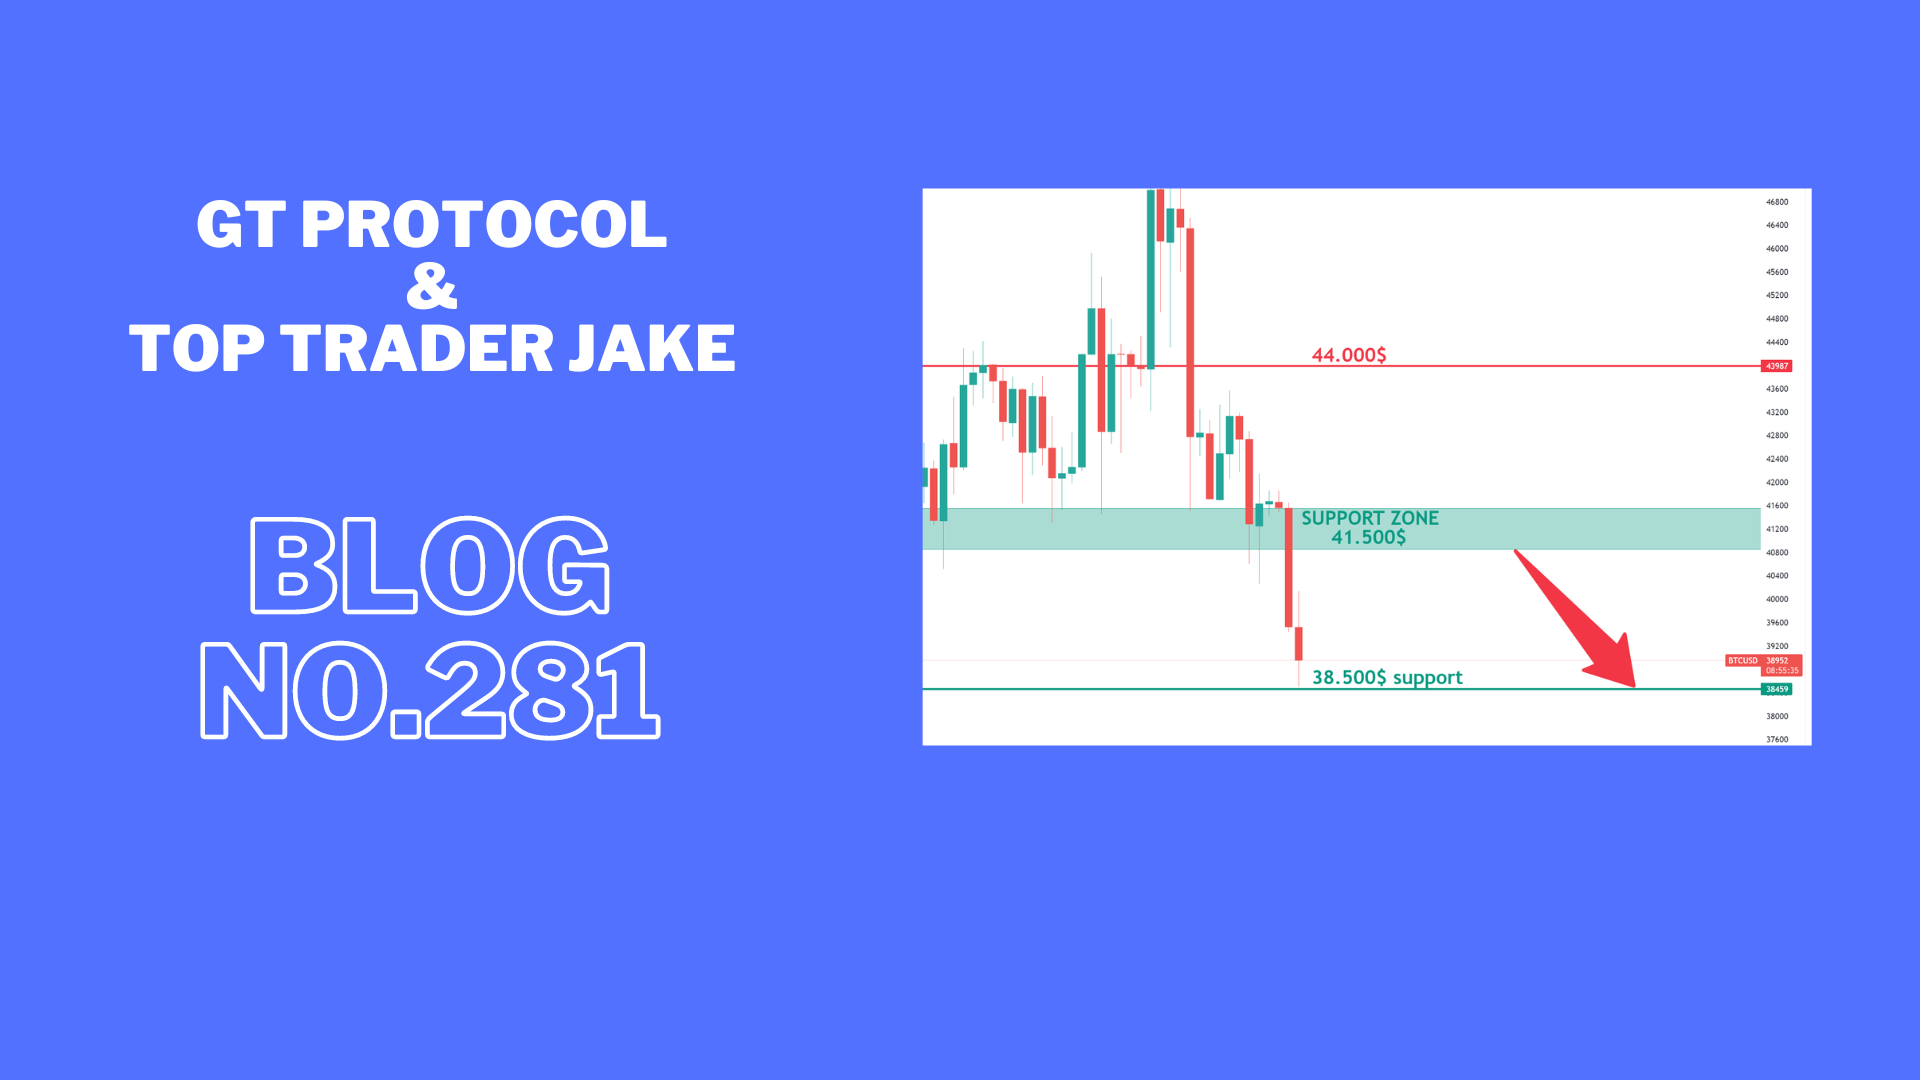


BTC tested old support at 38.500$ and needs to hold above for bullish continuation.
Jake
TOP Trader
BTC:
INTRO: BTC testing 38.5k support
Technical analysis for the BTC/USDT chart:
Key Levels:
• Resistance: $41,500, $43,000
• Support: $38,500, $40,200
Strategy:
• Long: Buy at $38,500 with a stop loss below $37,000 and a target price of $41,000.
• Short: Sell at $41,500 with a stop loss above $42,500 and a target price of $40,200.
Range Description:
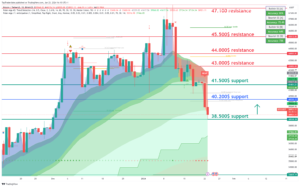
BTC/USDT is currently trading in a range between $38,500 and $42,000. The pair has broken into range during the day. However, there are signs that the pair is ready to make a move with possible retest of support.
On the upside, BTC/USDT is facing resistance at $41,500. And 41,500$ level has been tested today and if the price holds above on the daily close it will be confirmed as support. A break above $41,500 would signal a bullish breakout and could send the pair higher to $43,000.
On the downside, BTC/USDT is facing support at $40,200. This level is a previous resistance for the day and now holds as support. A break below $40,200 would signal a bearish breakdown and could send the pair lower to $38,000 or even $37,000.
BTC1D chart TW link: https://www.tradingview.com/x/M6lLFITE/
ETH:
INTRO: ETH testing support at 2200$.
Here is a technical analysis of the ETH/USDT chart:
Key Levels:
• Resistance: $2320, $2420
• Support: $2220, $2100
Strategy:
• Long: Buy at $2220 with a stop loss below $2100 and a target price of $2320.
• Short: Sell at $2320 with a stop loss above $2420 and a target price of $2200.
Range Description:
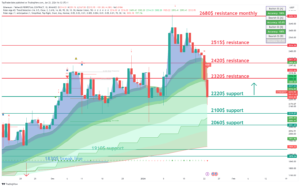
ETH/USDT is currently trading in a range between $2200 and $2500. The pair has broken into range during the day. However, there are signs that the pair is ready to make a move with possible retest of support.
On the upside, ETH/USDT is facing resistance at $2320. This level wasn’t tested today and if the price holds above on daily close it will be confirmed as support. A break above $2320 would signal a bullish breakout and could send the pair higher to $2320.
On the downside, ETH/USDT is facing support at $2220. This level is a previous swing low and has been tested multiple times in recent weeks as resistance. A break below $2220 would signal a bearish breakdown and could send the pair lower to $2120 or even $2000.
ETH1D chart TW link: https://www.tradingview.com/x/Z2ScoB2j/
XRP:
INTRO: XRP is holding above 0.5$ and needs to hold before the big nuke.
Here is a technical analysis of the XRP/USDT chart:
Key Levels:
• Resistance: $0.54, $0.58
• Support: $0.5, $0.52
Strategy:
• Long: Buy at $0.5 with a stop loss below $0.48 and a target price of $0.58.
• Short: Sell at $0.54 with a stop loss above $0.58 and a target price of $0.5.
Range Description:
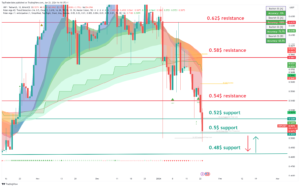
XRP/USDT is currently trading in a range between $0.5 and $0.54. The pair has shifted into range during the day. However, there are signs that the pair is ready to make a move with possible retest of support.
On the upside, XRP/USDT is facing resistance at $0.54. This level has been tested today and if the price holds above on the daily close it will be confirmed as support. A break above $0.54 would signal a bullish breakout and could send the pair higher to $0.58.
On the downside, XRP/USDT is facing support at $0.5. This level is a previous swing low and has been tested multiple times in recent weeks as big support. A break below $0.5 would signal a bearish breakdown and could send the pair lower to $0.48 or even $0.46.
XRP chart TW link: https://www.tradingview.com/x/SglOQRac/
LINK:
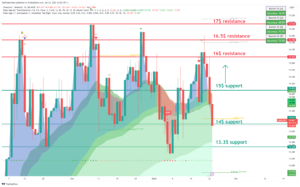
INTRO: LINK pushing high above 15$ resistance.
Here is a technical analysis for the LINK/USDT chart:
Key Levels:
• Resistance: $15, $16
• Support: $13.3, $14
Strategy:
• Long: Buy at $14 with a stop loss below $13 and a target price of $16.
• Short: Sell at $15 with a stop loss above $16.5 and a target price of $14.
Range Description:
LINK/USDT is currently trading in a range between $14 and $16. The pair has shifted into range during the day. However, there are signs that the pair is ready to make a move with possible retest of support.
On the upside, LINK/USDT is facing resistance at $15. This level has been tested today and if the price holds above on the daily close it will be confirmed as support. A break above $15 would signal a bullish breakout and could send the pair higher to $17.
On the downside, LINK/USDT is facing support at $14. This level is a previous swing low and has been tested multiple times in recent weeks as big resistance. A break below $14 would signal a bearish breakdown and could send the pair lower to $13 or even $12.
LINK chart TW link: https://www.tradingview.com/x/GXkbvVyV/
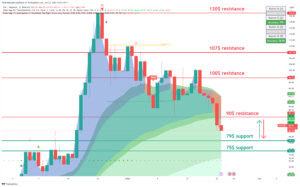
SOL:
INTRO: SOL fighting with 100$ resistance.
Here is a technical analysis of the SOL/USDT chart:
Key Levels:
• Resistance: $100, $90
• Support: $79, 75$
Strategy:
• Long: Buy at $79 with a stop loss below $75 and a target price of $100.
• Short: Sell at $90 with a stop loss above $100 and a target price of $90.
Range Description:
SOL/USDT is currently trading in a range between 75$ and 100$. However, there are signs that the pair is ready to make a move to push strong resistance at 90$.
On the upside, SOL/USDT is facing resistance at $90. This level it has been tested today and if the price holds above on the daily close it will be confirmed as support. A break above $90 would signal a bullish breakout and could send the pair higher to $100.
On the downside, SOL/USDT is facing support at $79. This level is a previous swing low and has been tested multiple times in recent weeks as big support. A break below $79 would signal a bearish breakdown and could send the pair lower to $70 or even $60.
SOL chart TW link: https://www.tradingview.com/x/MGH7eiGM/
CRYPTO NEWS:
WHERE’S ALL THE BITCOIN?
Every once in a while… a weird, funky question pops into my head.
Stuff like:
• If you try to fail and succeed, which one did you actually do?
• Why do we park in driveways and drive in parkways?
Sometimes people respond with “Whoa, good question.”
Most of the time, people look at me like I’m high.
Well over the weekend, one of these weird, funky questions popped into my head again…
The question: where is all the Bitcoin? (Like who owns them? People? Companies? Satoshi?)
After a quick search, this visual came up:
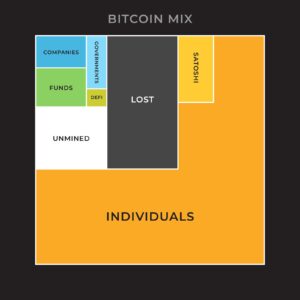
A few quick thoughts:
1. Governments say they hate Bitcoin, but they own A LOT of it…
The U.S. owns 215,000 BTC.
China owns 190,000 BTC.
Ukraine owns 46,350 BTC.
2. There’s 2x as much “lost” BTC as there is BTC held by governments and companies. Ouch.
3. Satoshi is one rich mfer. It’s estimated that the Bitcoin creator holds ~1,100,000 BTC (worth $44B+ at today’s prices).
That alone would make Satoshi the 28th richest person in the world…
Wild.
FAST NEWS:
A U.S. federal court has ordered an independent investigation into the FTX collapse. The bankrupt exchange will now face an independent investigation by a court-appointed examiner.
A sophisticated crypto scam operation has stolen $32M since April. The scammers create a token with misleading permissions, pump it with fake volume, rug the token once enough outside funds enter, and then repeat the process.
Bloomberg analysts believe there’s a 70% chance Coinbase wins its case against the SEC. Milk Road Rule #48: Analyst predictions are like weather forecasts… even if they say it’ll be sunny, bring an umbrella.
Arbitrum proposed an $85M grant program. The crypto project has a whopping $7B in its treasury, up from $3B in October.
Crypto crime was down 29% last year. According to the Chainalysis report, illicit revenue was also down 54%.
Final words:
The market losing support and now it is time to act and find new long entries if support holds.
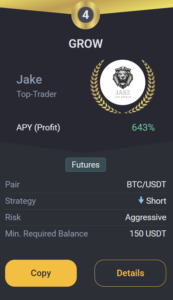
GROW BOT UPDATE:
Copy trade GROW 0.1->10k$ since 18.03 we got +215.0% PROFIT!
GROW CURRENTLY:
TRADING COIN: BTC/USDT
SETUP: SHORT
TAKE PROFIT: /
SAFETY ORDERS: /
Liquidation: /
Not Financial Advice!
Good luck with trades,
JAKE