

Alt are pushing hard up.
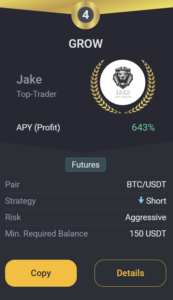
Jake
TOP Trader
BTC:
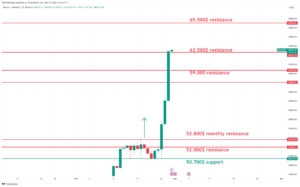
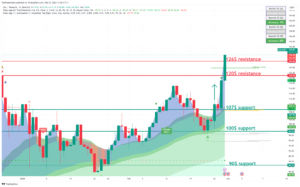
INTRO: BTC pushing into 63k resistance.
Technical analysis for the BTC/USDT chart:
Key Levels:
- Resistance: $63,000
- Support: $50,000, $48,200
Strategy:
- Long: Buy at $50,100 with a stop loss below $48,000 and a target price of $52,000.
- Short: Sell at $52,000 with a stop loss above $53,500 and a target price of $47,000.
Range Description:
BTC/USDT is currently trading between $47,000 and $52,000. The pair has broken into the range during the day. However, there are signs that the pair is ready to make a move with a possible retest of support.
On the upside, BTC/USDT is facing resistance at $50,000. The $50,000 level has been tested today, and if the price holds above it on a daily close, it will be confirmed as support. A break above $50,000 would signal a bullish breakout and could send the pair higher to $52,000.
On the downside, BTC/USDT is facing support at $48,500. This level was a previous resistance for the day and now holds as support. A break below $48,500 would signal a bearish breakdown, sending the pair lower to $45,000 or even $42,000.
BTC1D chart TW link: https://www.tradingview.com/x/S1DhvZHx/
ETH:
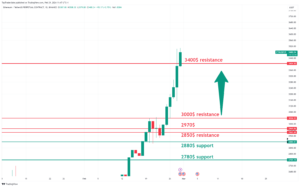
INTRO: ETH pushing to 3400$.
Here is a technical analysis of the ETH/USDT chart:
Key Levels:
- Resistance: $3400, $3300
- Support: $3000, $3100
Strategy:
- Long: Buy at $3200 with a stop loss below $3000 and a target price of $3400.
- Short: Sell at $3400 with a stop loss above $3500 and a target price of $3000.
Range Description:
ETH/USDT is currently trading between $3,000 and $3,400. The pair has broken into the range during the day. However, there are signs that the pair is ready to make a move with a possible retest of support.
On the upside, ETH/USDT is facing resistance at $3,400. This level hasn’t been tested today, and if the price holds above it on a daily close, it will be confirmed as support. A break above $3,400 would signal a bullish breakout and could send the pair higher to $3,500.
On the downside, ETH/USDT is facing support at $3,200. This level is a previous swing low and has been tested multiple times in recent weeks as resistance. A break below $3,200 would signal a bearish breakdown, sending the pair lower to $3,000 or even $2,900.
ETH1D chart TW link: https://www.tradingview.com/x/KmjnKFqT/
XRP:
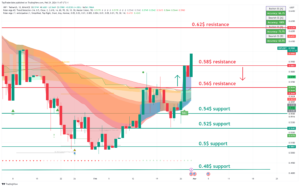
INTRO: XRP pushing into 0.58$
Here is a technical analysis of the XRP/USDT chart:
Key Levels:
- Resistance: $0.50, $0.52
- Support: $0.48, $0.46
Strategy:
- Long: Buy at $0.48 with a stop loss below $0.46 and a target price of $0.58.
- Short: Sell at $0.50 with a stop loss above $0.52 and a target price of $0.46.
Range Description:
XRP/USDT is currently trading between $0.48 and $0.52. The pair has shifted into the range during the day. However, there are signs that the pair is ready to make a move with a possible retest of support.
On the upside, XRP/USDT is facing resistance at $0.50. This level has been tested today, and if the price holds above it on a daily close, it will be confirmed as support. A break above $0.50 would signal a bullish breakout and could send the pair higher to $0.52.
On the downside, XRP/USDT is facing support at $0.48. This level is a previous swing low and has been tested multiple times in recent weeks as significant support. A break below $0.48 would signal a bearish breakdown and send the pair lower to $0.46 or even $0.44.
XRP chart TW link: https://www.tradingview.com/x/PomV7rHa/
LINK:
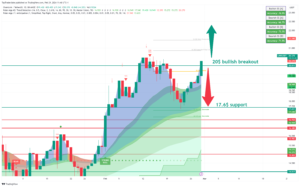
INTRO: LINK pushing into 20$.
Here is a technical analysis for the LINK/USDT chart:
Key Levels:
- Resistance: $20
- Support: $17.6
Strategy:
- Long: Buy at $17.6 with a stop loss below $17 and a target price of $20.
- Short: Sell at $20 with a stop loss above $21 and a target price of $17.6.
Range Description:
LINK/USDT is currently trading between $17 and $20. The pair has shifted into the range during the day. However, there are signs that the pair is ready to make a move with a possible retest of support.
On the upside, LINK/USDT is facing resistance at $20. This level has been tested today, and if the price holds above it on a daily close, it will be confirmed as support. A break above $20 would signal a bullish breakout and could send the pair higher to $22.
On the downside, LINK/USDT is facing support at $17.60. This level is a previous swing low and has been tested multiple times in recent weeks as significant resistance. A break below $17.60 would signal a bearish breakdown and could send the pair lower to $17 or even $16.
LINK chart TW link: https://www.tradingview.com/x/yEhUQLmO/
SOL:
INTRO: SOL retesting 120$ support.
Here is a technical analysis of the SOL/USDT chart:
Key Levels:
- Resistance: $100, $107
- Support: $79, 90$
Strategy:
- Long: Buy at $90 with a stop loss below $75 and a target price of $100.
- Short: Sell at $100 with a stop loss above $ 107 and a target price of $90.
Range Description:
SOL/USDT is currently trading between $75 and $100. However, there are signs that the pair is ready to make a move to push through strong resistance at $90.
On the upside, SOL/USDT is facing resistance at $100. This level has been tested today, and if the price holds above it on a daily close, it will be confirmed as support. A break above $100 would signal a bullish breakout and could send the pair higher to $107.
On the downside, SOL/USDT is facing support at $90. This level is a previous swing low and has been tested multiple times in recent weeks as significant support. A break below $90 would signal a bearish breakdown and could send the pair lower to $70 or even $60.
SOL chart TW link: https://www.tradingview.com/x/XO6vPDBk/
CRYPTO NEWS:
BTC IS GOING UP, UP, AND AWAY
This week’s crypto rally reminds me of one of my favorite scenes from Family Guy. Hear me out… In the episode, Peter Griffin (i.e., the main character) goes to a baseball game. Every time he has his back to the game, someone scores. But every time he turns around to watch, nothing big is happening. Right now, crypto feels the same way. BTC started the week at $52K.
Two days later… it’s at $61K.
1/ ETF issuers are buying up 10x more BTC than miners are producing.
This is a common trend we’ve been seeing since the Bitcoin ETFs launched last month.
Yesterday, it happened again…
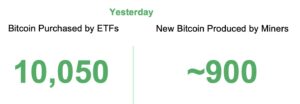
Why this matters: I got a “C-” in economics (C’s get degrees!), but even I know that when the demand for an asset is 10x the supply being produced… there’s a demand shock, and prices shoot up.
We’ll see how long the trend continues.
2/ Gold is losing its shine, while Bitcoin is in its prime. Check it out… Bitcoin ETFs are catching up to Gold ETFs.
Gold ETFs currently hold ~$92B.
Bitcoin ETFs currently hold ~$40.7B.
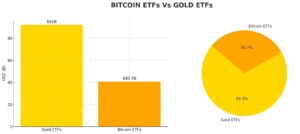
P.S. – According to Bloomberg analysts, there’s a good chance Bitcoin ETFs will surpass Gold ETFs in assets under management (AUM) within 2 years.
3/ Fidelity increased its BTC allocation. A few weeks ago, Fidelity added a small allocation (1%) of one of its funds to invest in BTC.
It’s a fund dedicated to “conservative” investments, AKA boring assets that get your grandparents excited.
It includes things like investment-grade debt, U.S. equities, international equities, etc.
Well, fast forward to today, Fidelity has added exposure to crypto across multiple funds…
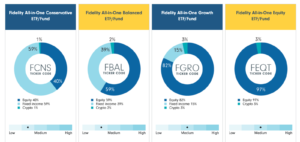
The best part? Fidelity increased its allocation from 1% → 3% for some of those funds.
Slowly, but surely, exposure to BTC is being normalized.
FAST NEWS:
The Ethereum Foundation announced that the DenCun network upgrade has been “successfully activated on all testnets.” Next up? Activating the upgrade on the main network is scheduled for March 13.
Kraken launched a new platform targeted at institutional investors. The services include using Kraken’s spot exchange, derivatives trading, qualified custody, and indices.
Telegram says it will start sharing ad revenue with users starting in March. All payments and withdrawals will be settled on the TON blockchain, a network created by the company that built Telegram.
Strike is rolling out its payment services in Africa. The services will be expanded into Gabon, Ivory Coast, Malawi, Nigeria, South Africa, Uganda, and Zambia – with more African markets to come in the future.
The “Newborn Nine” Bitcoin ETFs now hold 300,000 BTC (worth $17B). By the way, that’s about 1.5% of the current BTC supply.
VanEck launched a new NFT marketplace and digital assets platform called SegMint. VanEck was one of the first to apply for a spot in Bitcoin ETF, and now it’s one of the first to launch its own NFT marketplace.
Final words:
Altcoins are ready to push up and take your positions.
GROW BOT UPDATE:
Copy trade GROW 0.1->10k$ since 18.03.23 we got +219.0% PROFIT!
GROW CURRENTLY:
TRADING COIN: BTC/USDT
SETUP: SHORT
TAKE PROFIT: /
SAFETY ORDERS: /
Liquidation: /
Not Financial Advice!
Good luck with trades,
JAKE