

Altcoins bouncing back above support.
Jake
TOP Trader
BTC:
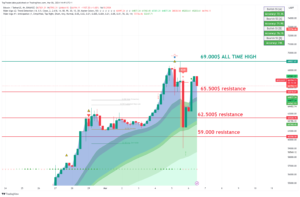
INTRO: BTC pushing into 65k resistance.
Technical analysis for the BTC/USDT chart:
Key Levels:
- Resistance: $65,000
- Support: $50,000, $48,200
Strategy:
- Long: Buy at $60,100 with a stop loss below $59,000 and a target price of $63,000.
- Short: Sell at $63,000 with a stop loss above $63,500 and a target price of $60,000.
Range Description:
BTC/USDT is currently trading between $60,000 and $63,000. The pair has broken into the range during the day. However, there are signs that the pair is ready to make a move with a possible retest of support.
On the upside, BTC/USDT is facing resistance at $50,000. The $50,000 level has been tested today, and if the price holds above the daily close, it will be confirmed as support. A break above $50,000 would signal a bullish breakout and could send the pair higher to $52,000.
On the downside, BTC/USDT is facing support at $48,500. This level was a previous resistance for the day and now holds as support. A break below $48,500 would signal a bearish breakdown, sending the pair lower to $45,000 or even $42,000.
BTC1D chart TW link: https://www.tradingview.com/x/xMwc5YIC/
ETH:
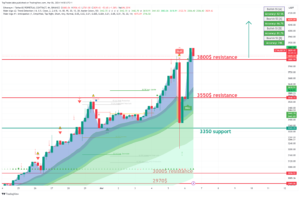
INTRO: ETH pushing to 3800$.
Here is a technical analysis of the ETH/USDT chart:
Key Levels:
- Resistance: $3550, $3300
- Support: $3350, $3300
Strategy:
- Long: Buy at $3300 with a stop loss below $3000 and a target price of $3500.
- Short: Sell at $3500 with a stop loss above $3600 and a target price of $3300.
Range Description:
ETH/USDT is currently trading between $3300 and $3500. The pair has broken into the range during the day. However, there are signs that the pair is ready to make a move with a possible retest of support.
On the upside, ETH/USDT is facing resistance at $3500. This level hasn’t been tested today, and if the price holds above it on the daily close, it will be confirmed as support. A break above $3500 would signal a bullish breakout and could send the pair higher to $3600.
On the downside, ETH/USDT is facing support at $3300. This level is a previous swing low and has been tested multiple times in recent weeks as resistance. A break below $3300 would signal a bearish breakdown and could send the pair lower to $3000 or even $2900.
ETH1D chart TW link: https://www.tradingview.com/x/ImgXKjoU/
XRP:
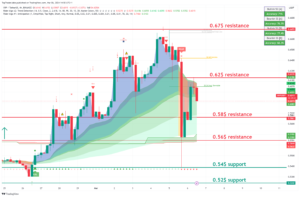
INTRO: XRP pushing into 0.62$
Here is a technical analysis of the XRP/USDT chart:
Key Levels:
- Resistance: $0.50, $0.52
- Support: $0.48, $0.46
Strategy:
- Long: Buy at $0.48 with a stop loss below $0.46 and a target price of $0.58.
- Short: Sell at $0.50 with a stop loss above $0.52 and a target price of $0.46.
Range Description:
XRP/USDT is currently trading between $0.48 and $0.52. The pair has shifted into the range during the day. However, there are signs that the pair is ready to make a move with a possible retest of support.
On the upside, XRP/USDT is facing resistance at $0.50. This level has been tested today, and if the price holds above it on the daily close, it will be confirmed as support. A break above $0.50 would signal a bullish breakout and could send the pair higher to $0.52.
On the downside, XRP/USDT is facing support at $0.48. This level is a previous swing low and has been tested multiple times in recent weeks as significant support. A break below $0.48 would signal a bearish breakdown and could send the pair lower to $0.46 or even $0.44.
XRP chart TW link: https://www.tradingview.com/x/ST0aA8wa/
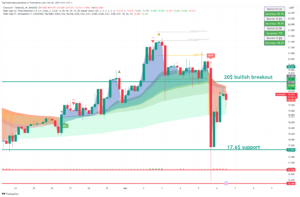
LINK:
INTRO: LINK pushing into 20$.
Here is a technical analysis for the LINK/USDT chart:
Key Levels:
- Resistance: $20
- Support: $17.6
Strategy:
- Long: Buy at $17.6 with a stop loss below $17 and a target price of $20.
- Short: Sell at $20 with a stop loss above $21 and a target price of $17.6.
Range Description:
LINK/USDT is currently trading between $17 and $20. The pair has shifted into the range during the day. However, there are signs that the pair is ready to make a move with a possible retest of support.
On the upside, LINK/USDT is facing resistance at $20. This level has been tested today, and if the price holds above it on the daily close, it will be confirmed as support. A break above $20 would signal a bullish breakout and could send the pair higher to $22.
On the downside, LINK/USDT is facing support at $17.6. This level is a previous swing low and has been tested multiple times in recent weeks as significant resistance. A break below $17.6 would signal a bearish breakdown and could send the pair lower to $17 or even $16.
LINK chart TW link: https://www.tradingview.com/x/E3v2Ivfj/
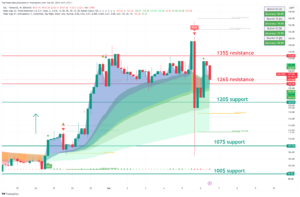
SOL:
INTRO: SOL pushing 135$.
Here is a technical analysis of the SOL/USDT chart:
Key Levels:
- Resistance: $135, $126
- Support: $120, 107$
Strategy:
- Long: Buy at $120 with a stop loss below $100 and a target price of $130.
- Short: Sell at $100 with a stop loss above $ 107 and a target price of $90.
Range Description:
SOL/USDT is currently trading between $120 and $140. However, there are signs that the pair is ready to make a move to push strong resistance at $150.
On the upside, SOL/USDT is facing resistance at $135. This level has been tested today, and if the price holds above it on the daily close, it will be confirmed as support. A break above $135 would signal a bullish breakout and could send the pair higher to $150.
On the downside, SOL/USDT is facing support at $120. This level is a previous swing low and has been tested multiple times in recent weeks as significant support. A break below $120 would signal a bearish breakdown and could send the pair lower to $100 or even $90.
SOL chart TW link: https://www.tradingview.com/x/sbSZq2d7/
CRYPTO NEWS:
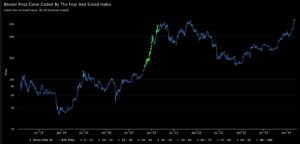
FEAR & GREED HITS 90!
The fear & greed (F&G) index is one of our favorite things to look at.
It’s a good way to understand how the market is “feeling.”
Here’s how it works:
- Each day, there’s a new number
- It ranges from 1 (extreme fear) —> 100 (extreme greed)
- How is it calculated?
- 25% Volatility (looking at 30 & 90-day average drawdowns)
- 25% Market volume (again, looking at 30 & 90-day averages)
- 15% of Social media mentions
- 15% Surveys
- 10% Market dominance (BTC vs. Altcoins)
- 10% Google Trends search volume
- 15% Concentrated Power Of Will™️
Well, the F&G index just did something I failed to do on any high school math test… scored a 90!
Why this matters: This is the first time the F&G index hit 90+ since 2021.
The last time it did? It stayed above 90 for a few months (green dots below) and BTC ended up rallying from $15K → $60K.
FAST NEWS:
Solana’s weekly DeFi trading volume reached $11B last week, setting a new weekly record!
The SEC has once again postponed its decision on BlackRock’s ETH ETF. This delay was widely anticipated, with most analysts expecting a decision on whether to approve or further postpone the launch of the ETH ETFs to come in May.
MicroStrategy is seeking to raise $600M through convertible notes. The company has stated its intention to use the funds “to acquire additional bitcoin and for general corporate purposes.”
Ethereum gas fees are surging, with the average fee for completing an NFT transaction on Ethereum reaching approximately $370 at certain points yesterday.
Some Coinbase users experienced a “zero balance” glitch in their accounts yesterday. It seems like there’s a 2-for-1 special happening, as the same issue occurred last week.
Deutsche Boerse, the operator of Germany’s largest stock exchange, is set to launch a crypto trading platform catering to institutional clients. The platform will provide a fully regulated ecosystem for trading, settlement, and custody of crypto assets.
Final words:
Late long take hit and now we see a bounce up this trend could continue.
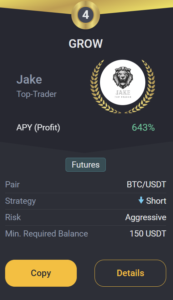
GROW BOT UPDATE:
Copy trade GROW 0.1->10k$ since 18.03.23 we got +219.0% PROFIT!
GROW CURRENTLY:
TRADING COIN: BTC/USDT
SETUP: SHORT
TAKE PROFIT: /
SAFETY ORDERS: /
Liquidation: /
Not Financial Advice!
Good luck with trades,
JAKE