

Signs that BTC is ready to make a move with possible retest of support.
Jake
TOP Trader
BTC:
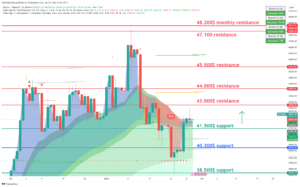
INTRO: BTC pushing resistance at 42k.
Technical analysis for the BTC/USDT chart:
Key Levels:
• Resistance: $44,000, $43,000
• Support: $41,500, $40,200
Strategy:
• Long: Buy at $41,500 with a stop loss below $40,000 and a target price of $44,000.
• Short: Sell at $43,000 with a stop loss above $44,500 and a target price of $40,200.
Range description:
BTC/USDT is currently trading in a range between $38,500 and $42,000. The pair has broken into range during the day. However, there are signs that the pair is ready to make a move with possible retest of support.
On the upside, BTC/USDT is facing resistance at $43,000. And 43,000$ level has been tested today and if the price holds above on the daily close it will be confirmed as support. A break above $43,000 would signal a bullish breakout and could send the pair higher to $45,000.
On the downside, BTC/USDT is facing support at $41,500. This level is a previous resistance for the day and now holds as support. A break below $41,500 would signal a bearish breakdown, sending the pair lower to $40,000 or even $39,000.
BTC1D chart TW link: https://www.tradingview.com/x/YUEhvjYN/
ETH:
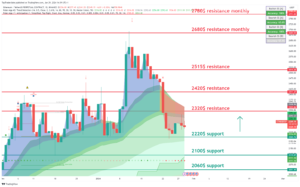
INTRO: ETH testing support at 2200$.
Here is a technical analysis of the ETH/USDT chart:
Key Levels:
• Resistance: $2320, $2420
• Support: $2220, $2100
Strategy:
• Long: Buy at $2220 with a stop loss below $2100 and a target price of $2320.
• Short: Sell at $2320 with a stop loss above $2420 and a target price of $2200.
Range description:
ETH/USDT is currently trading in a range between $2200 and $2500. The pair has broken into range during the day. However, there are signs that the pair is ready to make a move with possible retest of support.
On the upside, ETH/USDT is facing resistance at $2320. This level hasn’t been tested today and if the price holds above on the daily close it will be confirmed as support. A break above $2320 would signal a bullish breakout and could send the pair higher to $2320.
On the downside, ETH/USDT is facing support at $2220. This level is a previous swing low and has been tested multiple times in recent weeks as resistance. A break below $2220 would signal a bearish breakdown and could send the pair lower to $2120 or even $2000.
ETH1D chart TW link: https://www.tradingview.com/x/KOn2nZyY/
XRP:
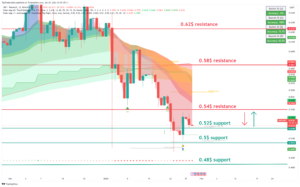
INTRO: XRP holding above 0.5$ and needs to hold before the big nuke.
Here is a technical analysis of the XRP/USDT chart:
Key Levels:
• Resistance: $0.54, $0.58
• Support: $0.5, $0.52
Strategy:
• Long: Buy at $0.5 with a stop loss below $0.48 and a target price of $0.58.
• Short: Sell at $0.54 with a stop loss above $0.58 and a target price of $0.5.
Range description:
XRP/USDT is currently trading in a range between $0.5 and $0.54. The pair has shifted into range during the day. However, there are signs that the pair is ready to make a move with possible retest of support.
On the upside, XRP/USDT is facing resistance at $0.54. This level has been tested today and if the price holds above on the daily close it will be confirmed as support. A break above $0.54 would signal a bullish breakout and could send the pair higher to $0.58.
On the downside, XRP/USDT is facing support at $0.5. This level is a previous swing low and has been tested multiple times in recent weeks as big support. A break below $0.5 would signal a bearish breakdown and could send the pair lower to $0.48 or even $0.46.
XRP chart TW link: https://www.tradingview.com/x/DE8kQHN4/
LINK:
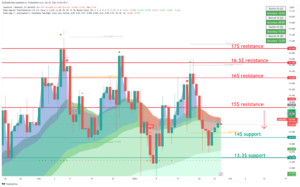
INTRO: LINK pushing high above 15$ resistance.
Here is a technical analysis for the LINK/USDT chart:
Key Levels:
• Resistance: $15, $16
• Support: $13.3, $14
Strategy:
• Long: Buy at $14 with a stop loss below $13 and a target price of $16.
• Short: Sell at $15 with a stop loss above $16.5 and a target price of $14.
Range description:
LINK/USDT is currently trading in a range between $14 and $16. The pair has shifted into range during the day. However, there are signs that the pair is ready to make a move with possible retest of support.
On the upside, LINK/USDT is facing resistance at $15. This level has been tested today and if the price holds above on the daily close it will be confirmed as support. A break above $15 would signal a bullish breakout and could send the pair higher to $17.
On the downside, LINK/USDT is facing support at $14. This level is a previous swing low and has been tested multiple times in recent weeks as big resistance. A break below $14 would signal a bearish breakdown and could send the pair lower to $13 or even $12.
LINK chart TW link: https://www.tradingview.com/x/jLtl4NjZ/
SOL:
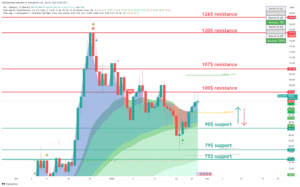
INTRO: SOL fighting with 100$ resistance.
Here is a technical analysis of the SOL/USDT chart:
Key Levels:
• Resistance: $100, $107
• Support: $79, 90$
Strategy:
• Long: Buy at $90 with a stop loss below $75 and a target price of $100.
• Short: Sell at $100 with a stop loss above $107 and a target price of $90.
Range description:
SOL/USDT is currently trading in a range between 75$ and 100$. However, there are signs that the pair is ready to make a move to push strong resistance at 90$.
On the upside, SOL/USDT is facing resistance at $100. This level it has been tested today and if the price holds above on the daily close it will be confirmed as support. A break above $100 would signal a bullish breakout and could send the pair higher to $107.
On the downside, SOL/USDT is facing support at $90. This level is a previous swing low and has been tested multiple times in recent weeks as big support. A break below $90 would signal a bearish breakdown and could send the pair lower to $70 or even $60.
SOL chart TW link: https: https://www.tradingview.com/x/LTwrBYys/
FAST NEWS:
The U.S. government filed a notice to sell $130M+ in Bitcoin. The funds are linked to the infamous Silk Road (no relation).
Spot bitcoin ETFs saw the highest level of net outflows in a single day. Grayscale Investments’ Bitcoin Trust ETF (GBTC) continued to weigh the group down, with $429 million leaving the fund.
The numbers are in… Base acquired ~2M users last year. Impressive for a 6-month-old chain.
Ethereum developers confirmed the next Dencun upgrade test run dates. Next up: Sepolia on January 30th. Then: Goerli on February 7th. (Yup, ETH is going on tour).
Swan Bitcoin launched a new mining business. It technically launched back in July, but has been in stealth mode. Swan has mined 750+ BTC since then.
Tesla still holds 9.720 BTC (worth $385M). The electric car maker didn’t buy or sell any BTC last quarter – it stayed in “Park” mode.
Final words:
The market is consolidating and a big amount of USDT coming into the market so prepare for a bigger push-up.
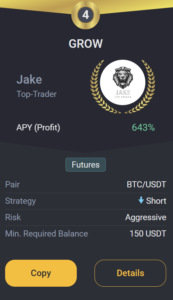
GROW BOT UPDATE:
Copy trade GROW 0.1->10k$ since 18.03.23 we got +219.0% PROFIT!
GROW CURRENTLY:
TRADING COIN: BTC/USDT
SETUP: SHORT
TAKE PROFIT: /
SAFETY ORDERS: /
Liquidation: /
Not Financial Advice!
Good luck with trades,
JAKE