Alt season loading prepare your positions.
Jake
TOP Trader
BTC:
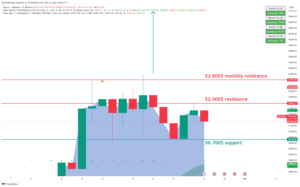
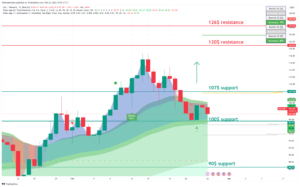
INTRO: BTC retesting 52k resistance.
Technical analysis for the BTC/USDT chart:
Key Levels:
• Resistance: $52,800, $52,000
• Support: $50,000, $48,200
Strategy:
• Long: Buy at $50,100 with a stop loss below $48,000 and a target price of $52,000.
• Short: Sell at $52,000 with a stop loss above $53,500 and a target price of $47,000.
Range Description:
BTC/USDT is currently trading in a range between $47,000 and $52,000. The pair has broken into range during the day. However, there are signs that the pair is ready to make a move with possible retest of support.
On the upside, BTC/USDT is facing resistance at $50,000. And 50,000$ level has been tested today and if the price holds above on the daily close it will be confirmed as support. A break above $50,000 would signal a bullish breakout and could send the pair higher to $52,000.
On the downside, BTC/USDT is facing support at $48,500. This level is a previous resistance for the day and now holds as support. A break below $48,500 would signal a bearish breakdown and could send the pair lower to $45,000 or even $42,000.
BTC1D chart TW link: https://www.tradingview.com/x/MVA5pDJa/
ETH:
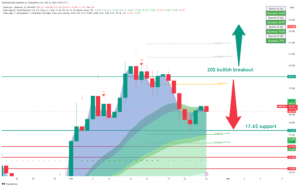
INTRO: ETH pushing above 3000$.
Here is a technical analysis of the ETH/USDT chart:
Key Levels:
• Resistance: $3000, $2850
• Support: $2515, $2780
Strategy:
• Long: Buy at $2780 with a stop loss below $2400 and a target price of $3000.
• Short: Sell at $3000 with a stop loss above $3100 and a target price of $2800.
Range Description:
ETH/USDT is currently trading in a range between $2800 and $3000. The pair has broken into range during the day. However, there are signs that the pair is ready to make a move with possible retest of support.
On the upside, ETH/USDT is facing resistance at $2780. This level wasn’t tested today and if the price holds above on the daily close it will be confirmed as support. A break above $2780 would signal a bullish breakout and could send the pair higher to $3000.
On the downside, ETH/USDT is facing support at $2515. This level is a previous swing low and has been tested multiple times in recent weeks as resistance. A break below $2515 would signal a bearish breakdown and could send the pair lower to $2300 or even $2200.
ETH1D chart TW link: https://www.tradingview.com/x/I3YGGDaN/
XRP:
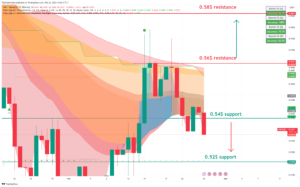
INTRO: XRP testing 0.54$ support.
Here is a technical analysis of the XRP/USDT chart:
Key Levels:
• Resistance: $0.50, $0.52
• Support: $0.48, $0.46
Strategy:
• Long: Buy at $0.48 with a stop loss below $0.46 and a target price of $0.58.
• Short: Sell at $0.50 with a stop loss above $0.52 and a target price of $0.46.
Range Description:
XRP/USDT is currently trading in a range between $0.48 and $0.52. The pair has shifted into range during the day. However, there are signs that the pair is ready to make a move with possible retest of support.
On the upside, XRP/USDT is facing resistance at $0.50. This level has been tested today and if the price holds above on the daily close it will be confirmed as support. A break above $0.50 would signal a bullish breakout and could send the pair higher to $0.52.
On the downside, XRP/USDT is facing support at $0.48. This level is a previous swing low and has been tested multiple times in recent weeks as big support. A break below $0.48 would signal a bearish breakdown and could send the pair lower to $0.46 or even $0.44.
XRP chart TW link: https://www.tradingview.com/x/tbKyKivN/
LINK:
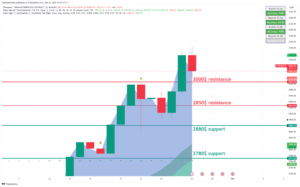
INTRO: LINK retesting 18$ support.
Here is a technical analysis for the LINK/USDT chart:
Key Levels:
• Resistance: $20
• Support: $17.6
Strategy:
• Long: Buy at $17.6 with a stop loss below $17 and a target price of $20.
• Short: Sell at $20 with a stop loss above $21 and a target price of $17.6.
Range Description:
LINK/USDT is currently trading in a range between $17 and $20. The pair has shifted into range during the day. However, there are signs that the pair is ready to make a move with possible retest of support.
On the upside, LINK/USDT is facing resistance at $20. This level has been tested today and if the price holds above on the daily close it will be confirmed as support. A break above $20 would signal a bullish breakout and could send the pair higher to $22.
On the downside, LINK/USDT is facing support at $17.6. This level is a previous swing low and has been tested multiple times in recent weeks as big resistance. A break below $17.6 would signal a bearish breakdown and could send the pair lower to $17 or even $16.
LINK chart TW link: https://www.tradingview.com/x/vr0XdcNJ/
SOL:
INTRO: SOL retesting 100$ support.
Here is a technical analysis of the SOL/USDT chart:
Key Levels:
• Resistance: $100, $107
• Support: $79, 90$
Strategy:
• Long: Buy at $90 with a stop loss below $75 and a target price of $100.
• Short: Sell at $100 with a stop loss above $107 and a target price of $90.
Range Description:
SOL/USDT is currently trading in a range between 75$ and 100$. However, there are signs that the pair is ready to make a move to push strong resistance at 90$.
On the upside, SOL/USDT is facing resistance at $100. This level it has been tested today and if the price holds above on the daily close it will be confirmed as support. A break above $100 would signal a bullish breakout and could send the pair higher to $107.
On the downside, SOL/USDT is facing support at $90. This level is a previous swing low and has been tested multiple times in recent weeks as big support. A break below $90 would signal a bearish breakdown and could send the pair lower to $70 or even $60.
SOL chart TW link: https://www.tradingview.com/x/baTAroOE/
CRYPTO NEWS:
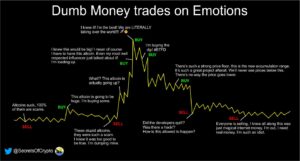
DUMB MONEY VS. SMART MONEY
Pop Quiz: What’s the difference between ‘dumb money’ and ‘smart money’?
Spoiler alert… it has nothing to do with your IQ level. Or where you went to school. Or what your grades were. (phew)
Ironically, it doesn’t even have to do with how “smart” or “dumb” someone is.
It has to do with one big thing… emotions. Specifically, how to control them.
You see, human behavior is driven by emotional impulses. And we all feel emotions – whether we want to, or not.
The big difference is: Dumb money trades on emotions…
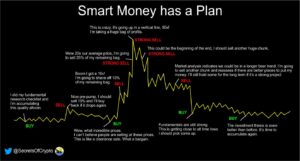
…while smart money, recognizes emotions but, doesn’t let them dictate their strategy.
They stick to the plan.
FAST NEWS:
Reddit says it invested a small amount of cash reserves into BTC and ETH. The social media giant also held $MATIC “as a form of payment for sales of certain virtual goods.”
CashApp made $66M in gross profit on its BTC sales last quarter. That’s a 90% year-over-year growth for the mobile payment app.
Paris Saint-Germain (PSG) has become a validator on the Chiliz Chain. The French soccer club has also pledged to pour the revenue earned from validating the Chiliz Chain into fan token buybacks.
Valkyrie launched a new BTC-leveraged product for investors. It’s a leveraged bitcoin futures ETF that aims to provide “2x the daily performance of the S&P CME Bitcoin Futures Index.”
Farcaster has added support for Solana. This allows Solana users to verify their addresses using the decentralized social media platform.
a16z invested $100M into EigenLayer. This is the “cherry on top” for the restaking protocol, whose total value locked (TVL) has jumped from $2B → $7.7B in less than a month.
Final words:
Altcoins are ready for the next leg up and ETH is leading the way up.
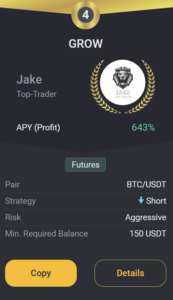
GROW BOT UPDATE:
Copy trade GROW 0.1->10k$ since 18.03.23 we got +219.0% PROFIT!
GROW CURRENTLY:
TRADING COIN: BTC/USDT
SETUP: SHORT
TAKE PROFIT: /
SAFETY ORDERS: /
Liquidation: /
Not Financial Advice!
Good luck with trades,
JAKE