

BTC pumping into resistance with altcoins following up.
Jake
TOP Trader
BTC:
INTRO: BTC pushing 47k resistance.
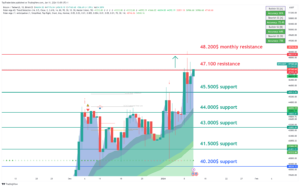
Technical analysis for the BTC/USDT chart:
Key Levels:
- Resistance: $48,200, $47,100
- Support: $44,000, $45,500
Strategy:
- Long: Buy at $45,500 with a stop loss below $43,000 and a target price of $48,000.
- Short: Sell at $47,000 with a stop loss above $48,500 and a target price of $45,000.
Range description:
BTC/USDT is currently trading in a range between $43,500 and $48,000. The pair has broken into the range during the day. However, there are signs that the pair is ready to make a move with a possible retest of support.
On the upside, BTC/USDT is facing resistance at $47,000, and the $47,000 level has been tested today. If the price holds above it on the daily close, it will be confirmed as support. A break above $47,000 would signal a bullish breakout and could send the pair higher to $48,500.
On the downside, BTC/USDT is facing support at $45,500. This level was a previous resistance for the day and now holds as support. A break below $45,500 would signal a bearish breakdown and could send the pair lower to $43,000 or even $40,000
BTC1D chart TW link: https://www.tradingview.com/x/Xkf31H1o/
ETH:
INTRO: ETH pushing above 2500$ and need to hold for bullish continuation.
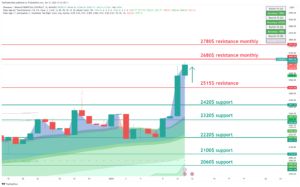
Here is a technical analysis for the ETH/USDT chart:
Key Levels:
- Resistance: $2515, $2680
- Support: $2420, $2320
Strategy:
- Long: Buy at $2220 with a stop loss below $2100 and a target price of $2420.
- Short: Sell at $2420 with a stop loss above $2520 and a target price of $2100.
Range description:
ETH/USDT is currently trading in a range between $2600 and $2400. The pair has broken into the range during the day. However, there are signs that the pair is ready to make a move with a possible retest of support.
On the upside, ETH/USDT is facing resistance at $2680. This level hasn’t been tested today, and if the price holds above it on the daily close, it will be confirmed as support. A break above $2680 would signal a bullish breakout and could send the pair higher to $2720.
On the downside, ETH/USDT is facing support at $2420. This level is a previous swing low and has been tested multiple times in recent weeks as resistance. A break below $2420 would signal a bearish breakdown and could send the pair lower to $2220 or even $2000.
ETH1D chart TW link: https://www.tradingview.com/x/ay2f9Ces/
XRP:
INTRO: XRP holding above 0.58$ and need hold up to catch up with BTC.
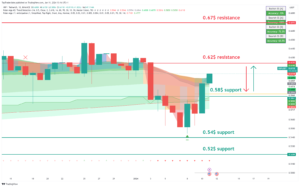
Here is a technical analysis for the XRP/USDT chart:
Key Levels:
- Resistance: $0.62, $0.67
- Support: $0.54, $0.58
Strategy:
- Long: Buy at $0.58 with a stop loss below $0.52 and a target price of $0.62.
- Short: Sell at $0.62 with a stop loss above $0.67 and a target price of $0.58.
Range description:
XRP/USDT is currently trading in a range between $0.54 and $0.62. The pair has shifted into the range during the day. However, there are signs that the pair is ready to make a move with a possible retest of support.
On the upside, XRP/USDT is facing resistance at $0.62. This level has been tested today, and if the price holds above it on the daily close, it will be confirmed as support. A break above $0.62 would signal a bullish breakout and could send the pair higher to $0.67.
On the downside, XRP/USDT is facing support at $0.58. This level is a previous swing low and has been tested multiple times in recent weeks as significant support. A break below $0.58 would signal a bearish breakdown and could send the pair lower to $0.54 or even $0.48.
XRP chart TW link: https://www.tradingview.com/x/1RZpYPL4/
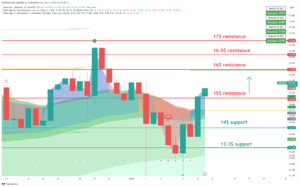
LINK:
INTRO: LINK pushing high above 15$ resistance.
Here is a technical analysis for the LINK/USDT chart:
Key Levels:
- Resistance: $15, $16
- Support: $13.3, $14
Strategy:
- Long: Buy at $14 with a stop loss below $13 and a target price of $16.
- Short: Sell at $15 with a stop loss above $16 and a target price of $14.
Range description:
LINK/USDT is currently trading in a range between $14 and $17. The pair has shifted into the range during the day. However, there are signs that the pair is ready to make a move with a possible retest of support.
On the upside, LINK/USDT is facing resistance at $15. This level has been tested today, and if the price holds above it on the daily close, it will be confirmed as support. A break above $15 would signal a bullish breakout and could send the pair higher to $16.
On the downside, LINK/USDT is facing support at $14. This level is a previous swing low and has been tested multiple times in recent weeks as significant resistance. A break below $14 would signal a bearish breakdown and could send the pair lower to $13 or even $13.
LINK chart TW link: https://www.tradingview.com/x/cgAZIwUV/
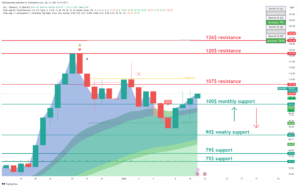
SOL:
INTRO: SOL pushing above 100$ strongly.
Here is a technical analysis for the SOL/USDT chart:
Key Levels:
- Resistance: $107, $120
- Support: $90, 100$
Strategy:
- Long: Buy at $100 with a stop loss below $90 and a target price of $120.
- Short: Sell at $107 with a stop loss above $120 and a target price of $100.
Range description:
SOL/USDT is currently trading in a range between $100 and $126. However, there are signs that the pair is ready to make a move to push strong resistance at $120.
On the upside, SOL/USDT is facing resistance at $107. This level has been tested today, and if the price holds above it on the daily close, it will be confirmed as support. A break above $107 would signal a bullish breakout and could send the pair higher to $126.
On the downside, SOL/USDT is facing support at $100. This level is a previous swing low and has been tested multiple times in recent weeks as significant support. A break below $100 would signal a bearish breakdown and could send the pair lower to $90 or even $80.
SOL chart TW link: https://www.tradingview.com/x/efvfTlpL/
CRYPTO NEWS:
1 BIG THING TO WATCH: ETH/BTC
Every investor should be tracking one thing… trading pairs.
TLDR – it’s a good way to compare how assets perform relative to each other.
One of the most popular trading pairs is ETH/BTC. And it’s been getting a lot of attention recently…
Why? Earlier this week, it hit its lowest point since April 2021.
In other words, if crypto were a prison yard, ETH would be Bitcoin’s B*tch.
Well, check it out. Something interesting happened yesterday… after the fake ETF approval went viral, ETH/BTC started pumping.

Why this matters: Although the tweet was fake, the market’s initial reaction to it probably wasn’t.
And some think “the market showed its hand” yesterday:
- BTC pumped right after the news, but then quickly dumped (even before the SEC confirmed the tweet was fake).
- Investors started rotating money from BTC → ETH.
With Ethereum’s upcoming network upgrades and a potential ETF coming later this year, everyone should keep a close eye on ETH/BTC.
FAST NEWS:
Fox and Polygon are teaming up to create a new blockchain called Verify. The goal: authenticate digital media content ranging from articles to images.
MicroStrategy nears $3B in BTC profit. The company’s total holdings were purchased for $5.9B at an average price of $31,409. Not too shabby for a software company.
The 40-day correlation between Bitcoin and NASDAQ has hit zero. BTC and NDX are breaking up like couples that just met for the first time on the show Love Is Blind.
Gary Gensler’s “compromised” Bitcoin ETF tweet was inscribed onto the Bitcoin blockchain. It has been immortalized, forever.
BitPay now allows customers to pay for goods and bills with BNB, Chainlink, and other tokens. BitPay customers can use crypto to buy stuff at places like Gucci, Ralph Lauren, and AMC Theatres and make car/mortgage payments.
Final words:
ETF is on and we could see bigger push up from Altcoins after big push from BTC. Now is time to switch to Altcoins to catch up.
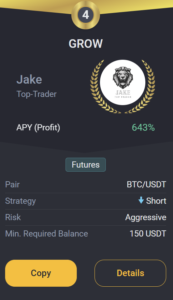
GROW BOT UPDATE:
Copy trade GROW 0.1->10k$ since 18.03 we got +214.0% PROFIT!
GROW CURENTLY:
TRADING COIN: BTC/USDT
SETUP: SHORT
TAKE PROFIT: /
SAFETY ORDERS: /
Liquidation: /
Not Financial Advice!
Good luck with trades,
JAKE