

Dear traders,
The market is still holding at support, and BTC needs to stay above 40k for bullish continuation.
Jake
TOP Trader
BTC:
INTRO: BTC still holds above 41k, but a stronger buying push is what we need for bullish continuation.
Technical analysis for the BTC/USDT chart:
Key Levels:
- Resistance: $43,000, $41,500
- Support: $38,500, $41,500
Strategy:
- Long: Buy at $41.500 with a stop loss below $40,000 and a target price of $44,000.
- Short: Sell at $44,000 with a stop loss above $45,500 and a target price of $40,000.
Range description:
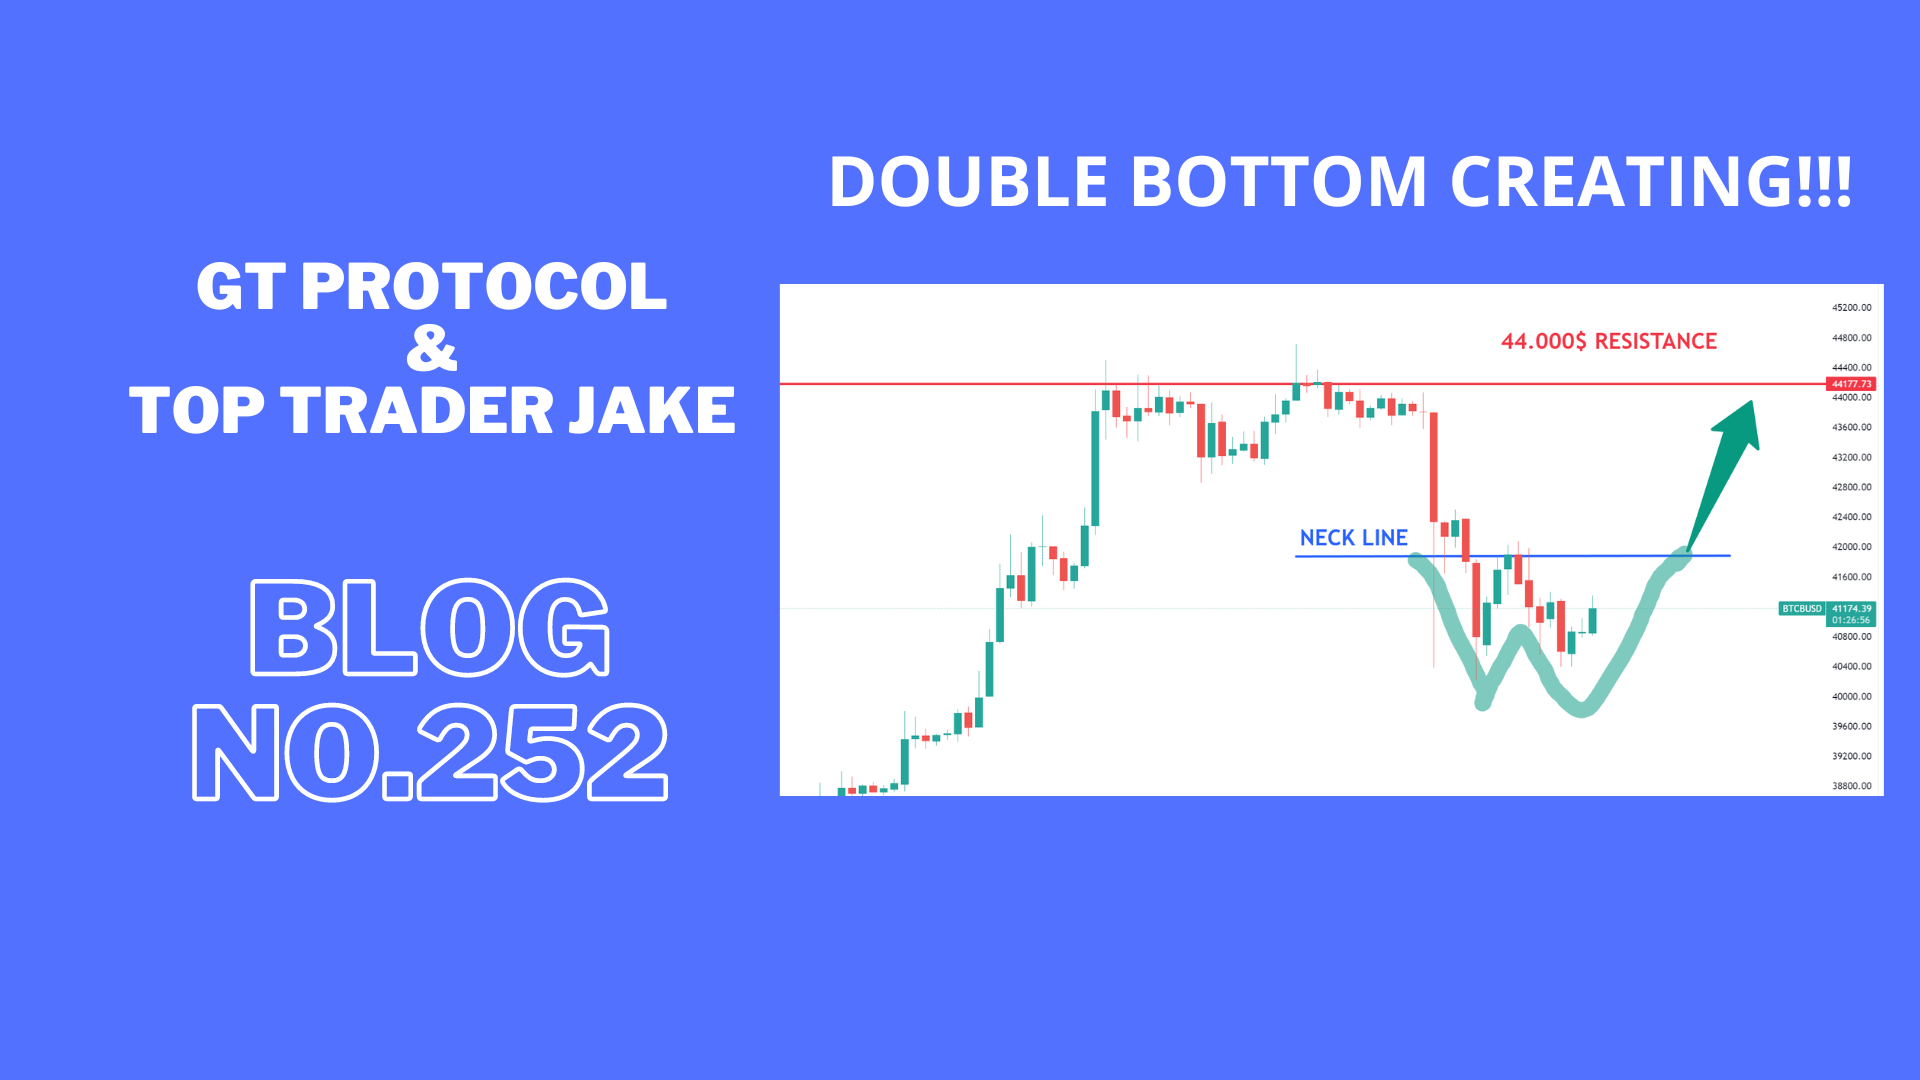
BTC/USDT is currently trading in a range between $41,500 and $44,000. The pair has broken into the range during the day. However, there are signs that the pair is ready to make a move with a possible retest of support.
On the upside, BTC/USDT is facing resistance at $44,000, and the $43,000 level has been tested today. If the price holds above on the daily close, it will be confirmed as support. A break above $44,000 would signal a bullish breakout and could send the pair higher to $45,500.
On the downside, BTC/USDT is facing support at $43,000. This level was a previous resistance for the day and now holds as support. A break below $40,000 would signal a bearish breakdown and could send the pair lower to $37,000 or even $35,000.
BTC1D chart TW link: https://www.tradingview.com/x/rjEkUAUG/
ETH:
INTRO: ETH breaks support at $2300 and needs to push back for bullish continuation. Still, a bigger sell-off is possible, and a retest of $2100 support may occur.
Here is a technical analysis for the ETH/USDT chart:
Key Levels:
- Resistance: $2220, $2420
- Support: $2060, $2100
Strategy:
- Long: Buy at $2300 with a stop loss below $2100 and a target price of $2515.
- Short: Sell at $2220 with a stop loss above $2320 and a target price of $2100.
Range description:
ETH/USDT is currently trading in a range between $2100 and $2400. The pair has broken into the range during the day. However, there are signs that the pair is ready to make a move with a possible retest of support.
On the upside, ETH/USDT is facing resistance at $2220. This level hasn’t been tested today, and if the price holds above on the daily close, it will be confirmed as support. A break above $2220 would signal a bullish breakout and could send the pair higher to $2320.
On the downside, ETH/USDT is facing support at $2100. This level is a previous swing low and has been tested multiple times in recent weeks as resistance. A break below $2100 would signal a bearish breakdown and could send the pair lower to $2000 or even $1900.
ETH1D chart TW link: https://www.tradingview.com/x/p48yIH8d/
XRP:
INTRO: XRP still struggles with the $0.62 resistance and needs to break it for full bullish confirmation. There is still a lack of buy volume for a push-up. A strong push-up to $0.67 is what will break the significant resistance and propel it strongly upward.
Here is a technical analysis for the XRP/USDT chart:
Key Levels:
- Resistance: $0.62, $0.67
- Support: $0.58, $0.54
Strategy:
- Long: Buy at $0.62 with a stop loss below $0.58 and a target price of $0.67.
- Short: Sell at $0.62 with a stop loss above $0.67 and a target price of $0.58.
Range description:
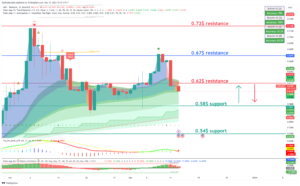
XRP/USDT is currently trading in a range between $0.58 and $0.67. The pair has shifted into this range during the day. However, there are signs that the pair is ready to make a move with a possible retest of support.
On the upside, XRP/USDT is facing resistance at $0.66. This level has been tested today, and if the price holds above on the daily close, it will be confirmed as support. A break above $0.67 would signal a bullish breakout and could send the pair higher to $0.7.
On the downside, XRP/USDT is facing support at $0.62. This level is a previous swing low and has been tested multiple times in recent weeks as strong support. A break below $0.62 would signal a bearish breakdown and could send the pair lower to $0.58 or even $0.54.
XRP chart TW link: https://www.tradingview.com/x/Nl61tND0/
LINK:
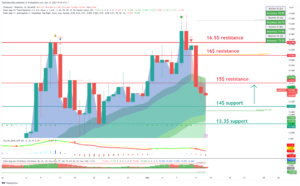
INTRO: LINK is retesting the $14 support level and needs to hold above $15 for bullish continuation.
Here is a technical analysis for the LINK/USDT chart:
Key Levels:
- Resistance: $16, $15
- Support: $13.3, $14
Strategy:
- Long: Buy at $14 with a stop loss below $13.3 and a target price of $16.
- Short: Sell at $15 with a stop loss above $16.5 and a target price of $14.
Range description:
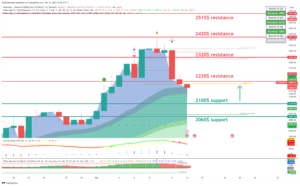
LINK/USDT is currently trading in a range between $14 and $16. The pair has shifted into a range during the day. However, there are signs that the pair is ready to make a move with a possible retest of support.
On the upside, LINK/USDT is facing resistance at $15. This level has been tested today, and if the price holds above on the daily close, it will be confirmed as support. A break above $15 would signal a bullish breakout and could send the pair higher to $17.
On the downside, LINK/USDT is facing support at $14. This level is a previous swing low and has been tested multiple times in recent weeks as significant resistance. A break below $14 would signal a bearish breakdown and could send the pair lower to $13 or even $12.
LINK chart TW link: https://www.tradingview.com/x/tIvbpRP0/
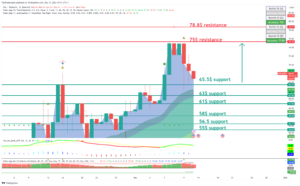
SOL:
INTRO: SOL is holding at $65 and needs a stronger push above for a bigger move.
Here is a technical analysis for the SOL/USDT chart:
Key Levels:
- Resistance: $75, $78.8
- Support: $65.5, $63
Strategy:
- Long: Buy at $65.5 with a stop loss below $61 and a target price of $75.
- Short: Sell at $75 with a stop loss above $78.8 and a target price of $65.5.
Range description:
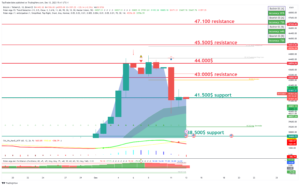
SOL/USDT is currently trading in a range between $65 and $75.50. However, there are signs that the pair is ready to make a move to push against strong resistance at $75.
On the upside, SOL/USDT is facing resistance at $75. This level has been tested today, and if the price holds above on the daily close, it will be confirmed as support. A break above $75 would signal a bullish breakout and could send the pair higher to $78.80.
On the downside, SOL/USDT is facing support at $65.50. This level is a previous swing low and has been tested multiple times in recent weeks as significant support. A break below $65.50 would signal a bearish breakdown and could send the pair lower to $62 or even $58.
SOL chart TW link: https: https://www.tradingview.com/x/MS5A8npy/
CRYPTO NEWS:
GRAPH OF THE DAY: 11 STRAIGHT WEEKS OF INFLOWS
The latest results from CoinShare’s weekly report are in…
Digital asset investment products saw $43M in inflows last week.
(PSA: Everyone, remain calm. That’s now 11 straight weeks of inflows)!
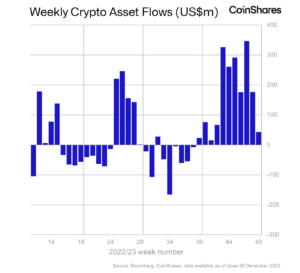
Here’s everything you need to know about the report:
- BTC led the way for cryptocurrencies with $20M in total inflows, bringing its year-to-date total to $1.7B.
- ETH saw $10M in inflows. That’s now 6 straight weeks of inflows, totaling $140M in that span.
- SOL and AVAX saw another week of inflows. Even institutional investors are lovin’ the altcoins!
On top of that, blockchain equities saw $126M. It’s the largest week of inflows on record. Period.
Big week. Big results. We’ll see if the momentum continues for another week.
FAST NEWS:
Phemex, a top spot and derivatives exchange, is launching PT Staking. The platform allocates 0.01% of the daily USDT contract trading volume to repurchase PT and distributes it as staking rewards to all vePT holders.
FIFA is launching NFTs that give holders a chance to secure World Cup finals tickets. Futbol. NFTs. World Cup Final. What’s not to love? Plus, it shows the power of NFTs – sure, you can “click-save-as” the image, but you can’t copy the perks.
Google will update its crypto ad policy starting on Jan. 29, 2024. The new policy will allow “crypto coin trusts” (i.e., funds that invest in cryptocurrencies) to serve ads in the U.S. upon completing a “certification process” and registering with the SEC.
Binance’s spot trading market share has plummeted from 55% to 30% over the last year. From January to September, the exchange’s monthly spot volumes declined by over 70%, from $474 billion to $114 billion. Ooof.
Decrypt signed a letter of intent to merge with Rug Radio. The merger marks the third major crypto media deal in the past month.
Final words:
Market holding support will this trend continue during this week or we could see a big drop.
WE celebrate 1 year of blog posting by Top Trader Jake we are happy to announce that we upgrade BLOG post with more information and trading setups!
Please send us message what coin would you like to see in Trader Jake Technical Analysis we are ready to add more coins and setups.
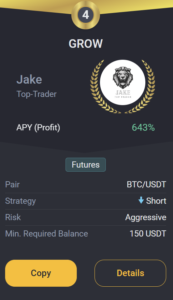
GROW BOT UPDATE:
Copy trade GROW 0.1->10k$ since 18.03 we got +165.0% PROFIT!
GROW CURENTLY:
TRADING COIN: BTC/USDT
SETUP: SHORT
TAKE PROFIT: 41,176 USDT
SAFETY ORDERS: 1/10
Liquidation: 87,000 USDT
Not Financial Advice!
Good luck with trades,
JAKE