

Market cooling from ETF news and now retesting support lines.
Jake
TOP Trader
BTC:
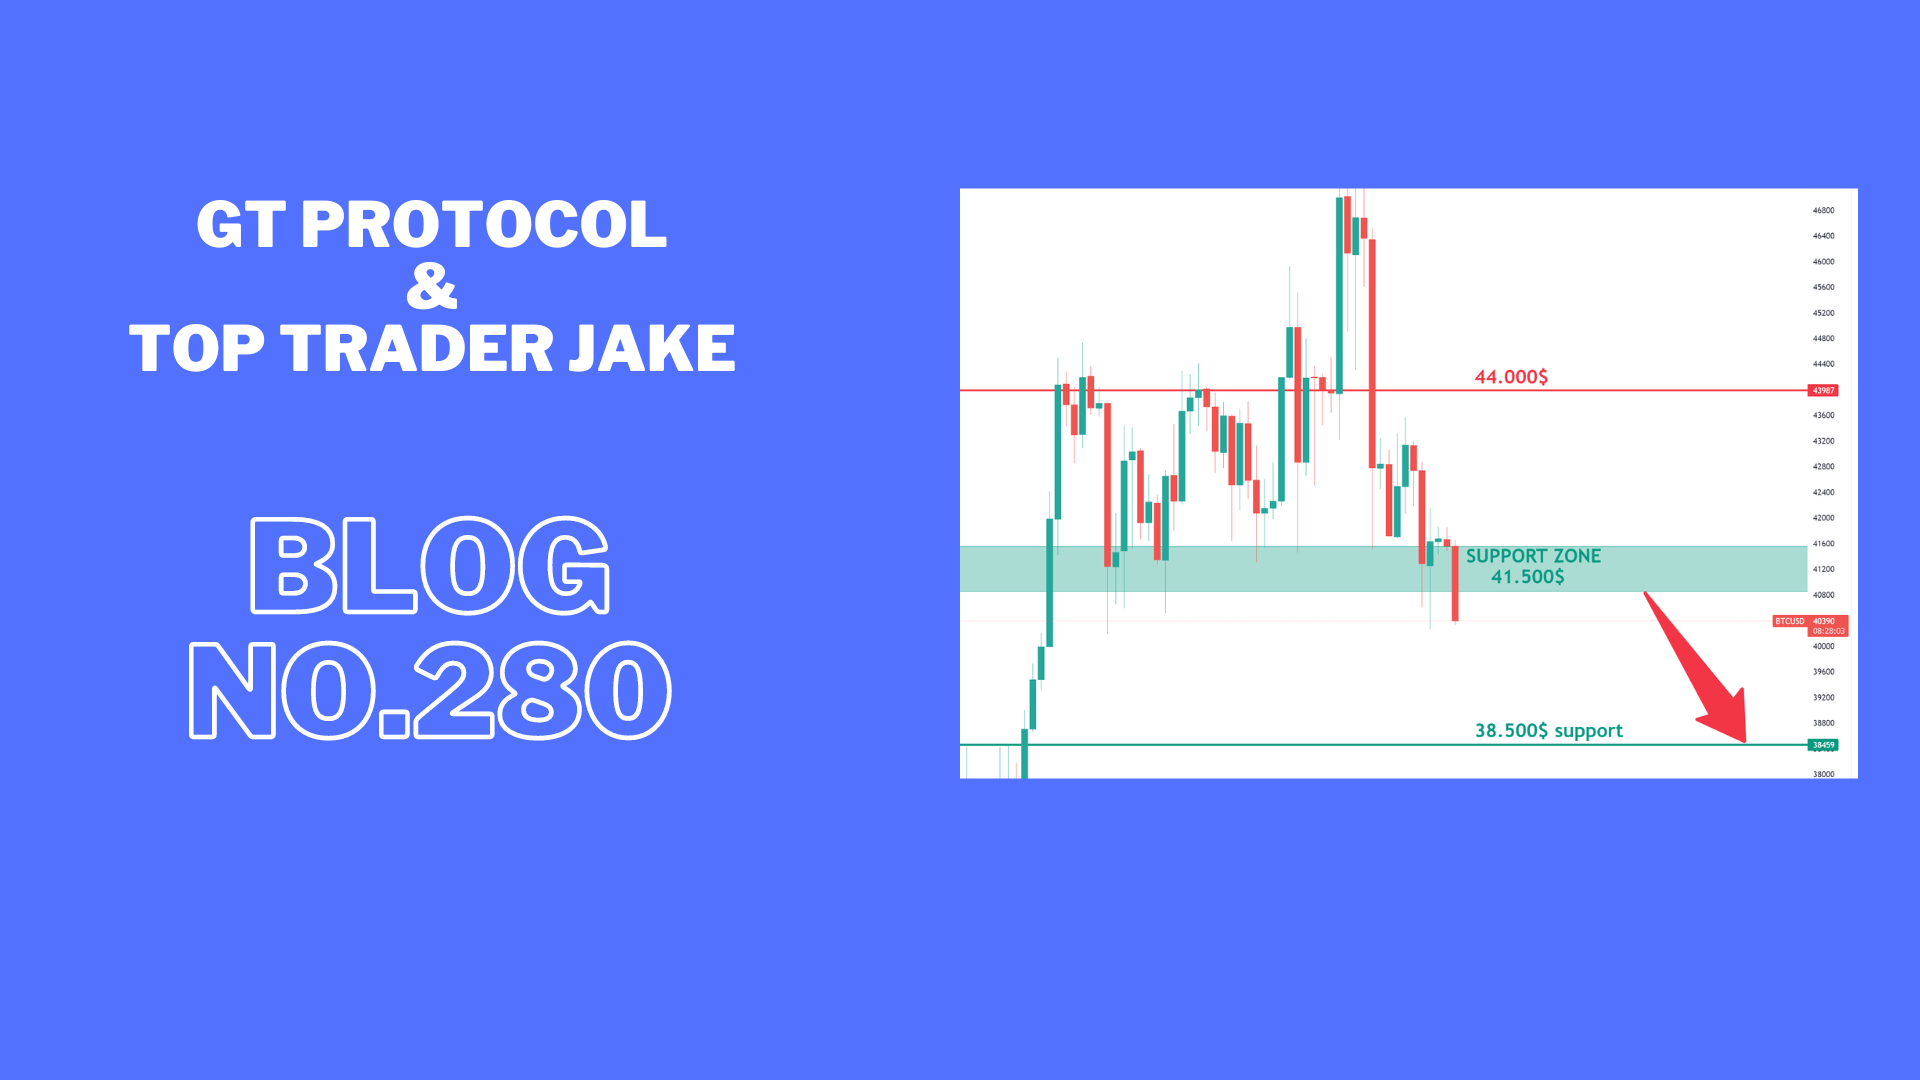
INTRO: BTC dropping from 41k support.
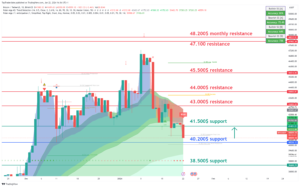
Technical analysis for the BTC/USDT chart:
Key Levels:
- Resistance: $43,000, $44,000
- Support: $41,500, $40,200
Strategy:
- Long: Buy at $41,500 with a stop loss below $40,000 and a target price of $43,000.
- Short: Sell at $43,000 with a stop loss above $44,500 and a target price of $41,000.
Range Description:
BTC/USDT is currently trading in a range between $40,500 and $42,000. The pair has broken into the range during the day. However, there are signs that the pair is ready to make a move with a possible retest of support.
On the upside, BTC/USDT is facing resistance at $43,000. The $43,000 level has been tested today, and if the price holds above the daily close, it will be confirmed as support. A break above $43,000 would signal a bullish breakout and could send the pair higher to $45,500.
On the downside, BTC/USDT is facing support at $41,500. This level was a previous resistance for the day and now holds as support. A break below $41,500 would signal a bearish breakdown and could send the pair lower to $40,000 or even $38,000.
BTC1D chart TW link: https://www.tradingview.com/x/tn7DgZVa/
ETH:
INTRO: ETH testing support under 2400$.
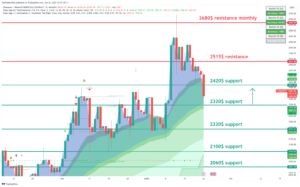
Here is a technical analysis of the ETH/USDT chart:
Key Levels:
- Resistance: $2780, $2680
- Support: $2420, $2515
Strategy:
- Long: Buy at $2320 with a stop loss below $2200 and a target price of $2520.
- Short: Sell at $2420 with a stop loss above $2520 and a target price of $2200.
Range Description:
ETH/USDT is currently trading in a range between $2300 and $2500. The pair has broken into the range during the day. However, there are signs that the pair is ready to make a move with a possible retest of support.
On the upside, ETH/USDT is facing resistance at $2420. This level hasn’t been tested today, and if the price holds above the daily close, it will be confirmed as support. A break above $2420 would signal a bullish breakout and could send the pair higher to $2520.
On the downside, ETH/USDT is facing support at $2320. This level is a previous swing low and has been tested multiple times in recent weeks as resistance. A break below $2320 would signal a bearish breakdown and could send the pair lower to $2220 or even $2000.
ETH1D chart TW link: https://www.tradingview.com/x/DE5cVmZP/
XRP:
INTRO: XRP is holding above $0.58 and should hold on to catch up to BTC.
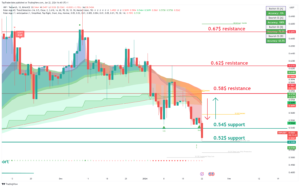
Here is a technical analysis of the XRP/USDT chart:
Key Levels:
- Resistance: $0.62, $0.58
- Support: $0.54, $0.52
Strategy:
- Long: Buy at $0.52 with a stop loss below $0.50 and a target price of $0.58.
- Short: Sell at $0.58 with a stop loss above $0.62 and a target price of $0.52.
Range Description:
XRP/USDT is currently trading in a range between $0.52 and $0.62. The pair has shifted into the range during the day. However, there are signs that the pair is ready to make a move with a possible retest of support.
On the upside, XRP/USDT is facing resistance at $0.54. This level has been tested today, and if the price holds above the daily close, it will be confirmed as support. A break above $0.54 would signal a bullish breakout and could send the pair higher to $0.58.
On the downside, XRP/USDT is facing support at $0.52. This level is a previous swing low and has been tested multiple times in recent weeks as significant support. A break below $0.52 would signal a bearish breakdown and could send the pair lower to $0.50 or even $0.48.
XRP chart TW link: https://www.tradingview.com/x/hr8j5zGI/
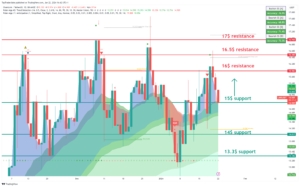
LINK:
INTRO: LINK pushing high above 15$ resistance.
Here is a technical analysis for the LINK/USDT chart:
Key Levels:
- Resistance: $16.5, $16
- Support: $15, $14
Strategy:
- Long: Buy at $15 with a stop loss below $13 and a target price of $16.
- Short: Sell at $16 with a stop loss above $16.5 and a target price of $14.
Range Description:
LINK/USDT is currently trading in a range between $14 and $17. The pair has shifted into the range during the day. However, there are signs that the pair is ready to make a move with a possible retest of support.
On the upside, LINK/USDT is facing resistance at $16. This level has been tested today, and if the price holds above the daily close, it will be confirmed as support. A break above $16 would signal a bullish breakout and could send the pair higher to $17.
On the downside, LINK/USDT is facing support at $15. This level is a previous swing low and has been tested multiple times in recent weeks as significant resistance. A break below $15 would signal a bearish breakdown and could send the pair lower to $14 or even $13.
LINK chart TW link: https://www.tradingview.com/x/t9rPEGXR/
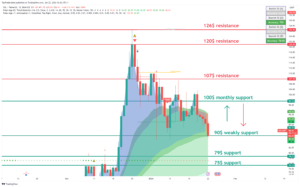
SOL:
INTRO: SOL fighting with 100$ resistance.
Here is a technical analysis of the SOL/USDT chart:
Key Levels:
- Resistance: $107, $120
- Support: $90, 100$
Strategy:
- Long: Buy at $100 with a stop loss below $90 and a target price of $120.
- Short: Sell at $107 with a stop loss above $120 and a target price of $100.
Range Description:
SOL/USDT is currently trading in a range between $100 and $126. However, there are signs that the pair is ready to make a move to push strong resistance at $120.
On the upside, SOL/USDT is facing resistance at $107. This level has been tested today, and if the price holds above the daily close, it will be confirmed as support. A break above $107 would signal a bullish breakout and could send the pair higher to $126.
On the downside, SOL/USDT is facing support at $100. This level is a previous swing low and has been tested multiple times in recent weeks as significant support. A break below $100 would signal a bearish breakdown and could send the pair lower to $90 or even $80.
SOL chart TW link: https://www.tradingview.com/x/jfRURtJA/
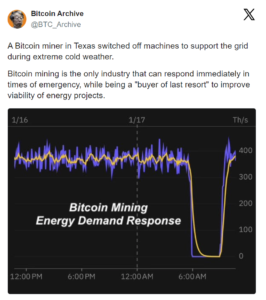
CRYPTO NEWS:
HOW BITCOIN MINERS ARE STABILIZING TEXAS’ ENERGY GRID
Texas is one of the weirdest places on Earth…
- In the summer, it gets so hot you can go outside and fry an egg on the sidewalk (not recommended, but it is possible).
- In the winter, it gets so cold you don’t even need a fridge/freezer – just leave your food outside, and it’ll stay cool (again… not recommended, but possible).
You get the best worst of both worlds in Texas.
Right now, it’s getting hit by an “Arctic Blast”. Which sounds like a new drink at Taco Bell, but it just means it’s extremely cold.
The problem: when Texas gets hit by extreme weather, the energy grid goes through a lot of stress.
The solution: Bitcoin miners are helping stabilize the energy grid.
- Miners get paid to curtail their operations and shut off their machines.
- As a result, it frees up energy on the grid that can be used elsewhere (i.e., homes, hospitals, local businesses).
It’s a win-win for everyone.
FAST NEWS:
Bitcoin surpasses silver to become the second-largest ETF commodity in the U.S. In the words of the great Ludacris… ‘move, b*tch, get out the way!’
dYdX surpassed Uniswap as the largest decentralized exchange (DEX) by volume. The DEX recently migrated from Ethereum to Cosmos and just saw $757M in volume over 24 hours.
The total value of crypto received by “illicit addresses” has dropped from $39B to $24.2B. This only made up about 0.34% of all on-chain transaction volume last year.
Tether bought $380M worth of Bitcoin. The stablecoin issuer now owns 66,464 BTC (worth ~$2.8B).
Bitcoin’s hash rate dropped 25% this week. The big reason? There’s a huge winter storm in Texas, so miners there are curtailing power to help strengthen the local power grid.
BlackRock says its spot bitcoin ETF is attracting a diverse investor base. BlackRock Head of U.S. iShares Product Rachel Aguirre said both retail and new investors are interested in the firm’s spot bitcoin ETF.
Final words:
The market finally stabilize and cleared late longs and testing supports for a bigger push up.
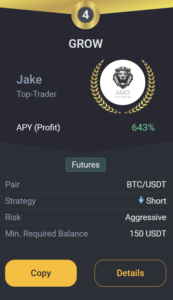
GROW BOT UPDATE:
Copy trade GROW 0.1->10k$ since 18.03 we got +215.0% PROFIT!
GROW CURRENTLY:
TRADING COIN: BTC/USDT
SETUP: SHORT
TAKE PROFIT: /
SAFETY ORDERS: /
Liquidation: /
Not Financial Advice!
Good luck with trades,
JAKE