

Alt is still on hold will we see the next leg up?
Jake
TOP Trader
BTC:
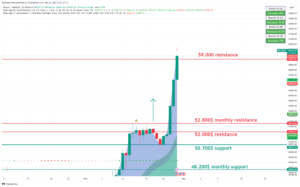
INTRO: BTC pushing into 59k resistance.
Technical analysis for the BTC/USDT chart:
Key Levels:
- Resistance: $59,000
- Support: $50,000, $48,200
Strategy:
- Long: Buy at $50,100 with a stop loss below $48,000 and a target price of $52,000.
- Short: Sell at $52,000 with a stop loss above $53,500 and a target price of $47,000.
Range Description:
BTC/USDT is currently trading between $47,000 and $52,000. The pair has broken into the range during the day. However, there are signs that the pair is ready to make a move with a possible retest of support.
On the upside, BTC/USDT is facing resistance at $50,000. The $50,000 level has been tested today, and if the price holds above it on a daily close, it will be confirmed as support. A break above $50,000 would signal a bullish breakout and could send the pair higher to $52,000.
On the downside, BTC/USDT is facing support at $48,500. This level was a previous resistance for the day and now holds as support. A break below $48,500 would signal a bearish breakdown, sending the pair lower to $45,000 or even $42,000.
BTC1D chart TW link: https://www.tradingview.com/x/VbIrvW2Z/
ETH:
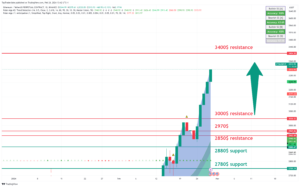
INTRO: ETH pushing to 3400$.
Here is a technical analysis of the ETH/USDT chart:
Key Levels:
- Resistance: $3400, $3300
- Support: $3000, $3100
Strategy:
- Long: Buy at $3200 with a stop loss below $3000 and a target price of $3400.
- Short: Sell at $3400 with a stop loss above $3500 and a target price of $3000.
Range Description:
ETH/USDT is currently trading between $3,000 and $3,400. The pair has broken into the range during the day. However, there are signs that the pair is ready to make a move with a possible retest of support.
On the upside, ETH/USDT is facing resistance at $3,400. This level hasn’t been tested today, and if the price holds above it on a daily close, it will be confirmed as support. A break above $3,400 would signal a bullish breakout and could send the pair higher to $3,500.
On the downside, ETH/USDT is facing support at $3,200. This level is a previous swing low and has been tested multiple times in recent weeks as resistance. A break below $3,200 would signal a bearish breakdown, sending the pair lower to $3,000 or even $2,900.
ETH1D chart TW link: https://www.tradingview.com/x/5ZHIispu/
XRP:
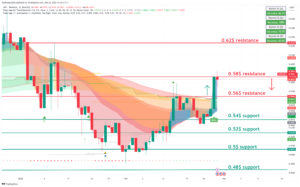
INTRO: XRP pushing into 0.56$.
Here is a technical analysis of the XRP/USDT chart:
Key Levels:
- Resistance: $0.50, $0.52
- Support: $0.48, $0.46
Strategy:
- Long: Buy at $0.48 with a stop loss below $0.46 and a target price of $0.58.
- Short: Sell at $0.50 with a stop loss above $0.52 and a target price of $0.46.
Range Description:
XRP/USDT is currently trading between $0.48 and $0.52. The pair has shifted into the range during the day. However, there are signs that the pair is ready to make a move with a possible retest of support.
On the upside, XRP/USDT is facing resistance at $0.50. This level has been tested today, and if the price holds above it on a daily close, it will be confirmed as support. A break above $0.50 would signal a bullish breakout and could send the pair higher to $0.52.
On the downside, XRP/USDT is facing support at $0.48. This level is a previous swing low and has been tested multiple times in recent weeks as significant support. A break below $0.48 would signal a bearish breakdown and send the pair lower to $0.46 or even $0.44.
XRP chart TW link: https://www.tradingview.com/x/RF2H2gyY/
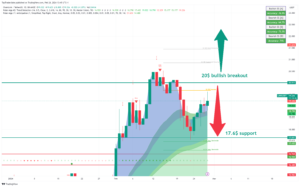
LINK:
INTRO: LINK pushing into 19$.
Here is a technical analysis for the LINK/USDT chart:
Key Levels:
- Resistance: $20
- Support: $17.6
Strategy:
- Long: Buy at $17.6 with a stop loss below $17 and a target price of $20.
- Short: Sell at $20 with a stop loss above $21 and a target price of $17.6.
Range Description:
LINK/USDT is currently trading between $17 and $20. The pair has shifted into the range during the day. However, there are signs that the pair is ready to make a move with a possible retest of support.
On the upside, LINK/USDT is facing resistance at $20. This level has been tested today, and if the price holds above it on a daily close, it will be confirmed as support. A break above $20 would signal a bullish breakout and could send the pair higher to $22.
On the downside, LINK/USDT is facing support at $17.60. This level is a previous swing low and has been tested multiple times in recent weeks as significant resistance. A break below $17.60 would signal a bearish breakdown and could send the pair lower to $17 or even $16.
LINK chart TW link: https://www.tradingview.com/x/pBiPVaPO/
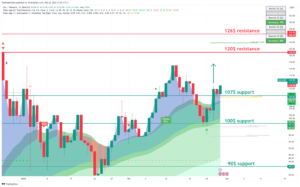
SOL:
INTRO: SOL retesting 107$ support.
Here is a technical analysis of the SOL/USDT chart:
Key Levels:
- Resistance: $100, $107
- Support: $79, 90$
Strategy:
- Long: Buy at $90 with a stop loss below $75 and a target price of $100.
- Short: Sell at $100 with a stop loss above $ 107 and a target price of $90.
Range Description:
SOL/USDT is currently trading between $75 and $100. However, there are signs that the pair is ready to make a move to push through strong resistance at $90.
On the upside, SOL/USDT is facing resistance at $100. This level has been tested today, and if the price holds above it on a daily close, it will be confirmed as support. A break above $100 would signal a bullish breakout and could send the pair higher to $107.
On the downside, SOL/USDT is facing support at $90. This level is a previous swing low and has been tested multiple times in recent weeks as significant support. A break below $90 would signal a bearish breakdown and send the pair lower to $70 or even $60.
SOL chart TW link: https://www.tradingview.com/x/9Z3o1acf/
CRYPTO NEWS:
PRICES ARE 50 SHADES OF GREEN
Sometimes in life… you just gotta let the money do the talking.
So today we’re gonna do exactly that. No witty intro. No funny story. Nada.
Instead, enjoy the view:
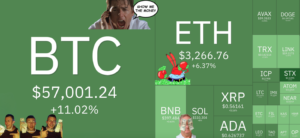
Beautiful, innit?
- BTC moonwalked past $57K for the first time since November 2021.
- ETH cha-cha slid past $3,200 for the first time in 22 months.
- Many altcoins are seeing double-digit gains, with some jumping over 50% in a day.
- The fear & greed index is almost at 80, for the first time in 2+ years.
So what’s behind the recent pump? Two words…
Institutional flows (which, btw, would also be a great name for a rap album).
- The 9 Bitcoin ETFs hit $2.4B in trading volume yesterday, a new all-time high.
- Institutional crypto funds saw $598M in total inflows last week, the 4th straight week of inflows.
- Not to mention… Michael Saylor’s been eating BTC for breakfast, lunch, and dinner. His firm (MicroStrategy) recently bought another $155M in BTC.
The bottom line: the Bitcoin ETFs changed the crypto game.
Matt Hougan (Chief Investment Officer at BitWise) summarized it best in his latest memo…
“Previously, only a fraction of the world’s investors could access Bitcoin—mostly self-directed retail investors and technologists. That group drove the price above $40,000. Now, thanks to the ETFs, every investor in the world—financial advisors, family offices, institutions, endowments, and others—can access Bitcoin. It’s like we went from 10 normal people bidding on a house to 100 very wealthy people bidding on a house, overnight. Not surprisingly, the price is going higher. How big a deal is this? Globally, asset and wealth managers control $115 trillion of capital, according to PWC. Almost none of this money could access Bitcoin in 2023. Today it can. If we see a 1% allocation to Bitcoin, that’s more than $1 trillion of buying … a figure that exceeds Bitcoin’s current market capitalization. To put it differently, it’s like Bitcoin had its initial public offering and the market is now finding its true price.” |
– Matt “Mr. CIO” Hougan |
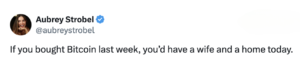
So, how’s the crypto community been reacting to the rally? The only way they know how…
Memes. A whole lot of them.
Here are some of our favorites:


FAST NEWS:
ETH has outpaced BTC so far this year. There are three big reasons: 1) an ETH ETF is expected to launch later this year, 2) Ethereum’s next big upgrade is in a few weeks, and 3) ETH held on exchanges is at an all-time low.
Memecoins like PEPE and WIF jumped 50% yesterday. According to CoinGecko, the “memecoin industry” saw an average gain of 13% on the day.
Uniswap launched three new tools to make token swapping easier. The tools include a Uniswap extension tool, a function for limiting orders on its web app, and a new data and insights web page.
Lido’s total value locked (TVL) jumped to over $30B. The liquid staking protocol now controls 32% of staked ETH.
OKX is launching a new localized version of the platform in Turkey. OKX will offer USDT/TRY, BTC/TRY, and ETH/TRY trading pairs for its local customers.
Hut 8 announced it will use its BTC reserves in a “new treasury strategy.” According to the company’s press release, “Bitcoin held in reserve may be deployed through direct sales, option strategies, or other approaches.”
Final words:
Prepere your altcoins positions big push-up is coming.
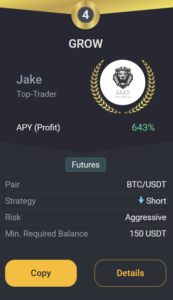
GROW BOT UPDATE:
Copy trade GROW 0.1->10k$ since 18.03.23 we got +219.0% PROFIT!
GROW CURRENTLY:
TRADING COIN: BTC/USDT
SETUP: SHORT
TAKE PROFIT: /
SAFETY ORDERS: /
Liquidation: /
Not Financial Advice!
Good luck with trades,
JAKE