

CPI data come bad this could trigger price back.
Jake
TOP Trader
BTC:
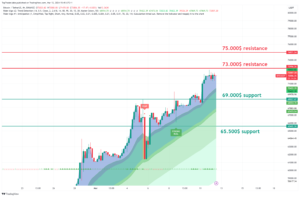
INTRO: BTC pushing above 70k$.
Technical analysis for the BTC/USDT chart:
Key Levels:
- Resistance: $75.000,$72.500
- Support: $69,000, $67,200
Strategy:
- Long: Buy at $69,100 with a stop loss below $65,000 and a target price of $75,000.
- Short: Sell at $75,000 with a stop loss above $77,500 and a target price of $69,000.
Range Description:
BTC/USDT is currently trading in a range between $67,000 and $73,000. The pair has broken into range during the day. However, there are signs that the pair is ready to make a move with possible retest of support.
On the upside, BTC/USDT is facing resistance at $73,000. The 73,000$ level has been tested today and if the price holds above on the daily close it will be confirmed as support. A break above $73,000 would signal a bullish breakout and could send the pair higher to $80,000.
On the downside, BTC/USDT is facing support at $48,500. This level is a previous resistance for the day and now holds as support. A break below $48,500 would signal a bearish breakdown, sending the pair lower to $45,000 or even $42,000.
BTC1D chart TW link: https://www.tradingview.com/x/cu7r9KsC/
ETH:
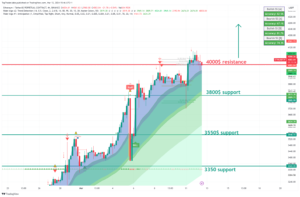
INTRO: ETH running into 4000$.
Here is a technical analysis of the ETH/USDT chart:
Key Levels:
- Resistance: $4000, $3800
- Support: $3700, $3600
Strategy:
- Long: Buy at $3700 with a stop loss below $3600 and a target price of $4000.
- Short: Sell at $4000 with a stop loss above $4100 and a target price of $3800.
Range Description:
ETH/USDT is currently trading in a range between $3800 and $4000. The pair has broken into range during the day. However, there are signs that the pair is ready to make a move with possible retest of support.
On the upside, ETH/USDT is facing resistance at $4000. This level hasn’t been tested today and if the price holds above on the daily close it will be confirmed as support. A break above $4000 would signal a bullish breakout and could send the pair higher to $4100.
On the downside, ETH/USDT is facing support at $3800. This level is a previous swing low and has been tested multiple times in recent weeks as resistance. A break below $3800 would signal a bearish breakdown and could send the pair lower to $3700 or even $3600.
ETH1D chart TW link: https://www.tradingview.com/x/J2LRNqZx/
XRP:
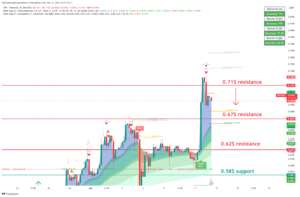
INTRO: XRP pushing new high 0.70$.
Here is a technical analysis of the XRP/USDT chart:
Key Levels:
- Resistance: $0.70, $0.67
- Support: $0.62, $0.64
Strategy:
- Long: Buy at $0.67 with a stop loss below $0.62 and a target price of $0.78.
- Short: Sell at $0.72 with a stop loss above $0.74 and a target price of $0.62.
Range Description:
XRP/USDT is currently trading in a range between $0.62 and $0.72. The pair has shifted into range during the day. However, there are signs that the pair is ready to make a move with possible retest of support.
On the upside, XRP/USDT is facing resistance at $0.70. This level has been tested today and if the price holds above on the daily close it will be confirmed as support. A break above $0.70 would signal a bullish breakout and could send the pair higher to $0.72.
On the downside, XRP/USDT is facing support at $0.67. This level is a previous swing low and has been tested multiple times in recent weeks as big support. A break below $0.67 would signal a bearish breakdown, sending the pair lower to $0.62 or even $0.60.
XRP chart TW link: https://www.tradingview.com/x/KDIgIfIe/
LINK:
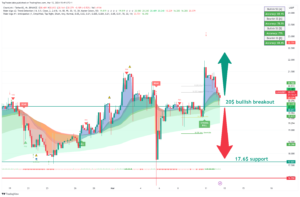
INTRO: LINK pushing above 20$.
Here is a technical analysis for the LINK/USDT chart:
Key Levels:
- Resistance: $20
- Support: $17.6
Strategy:
- Long: Buy at $17.6 with a stop loss below $17 and a target price of $20.
- Short: Sell at $20 with a stop loss above $21 and a target price of $17.6.
Range Description:
LINK/USDT is currently trading in a range between $17 and $20. The pair has shifted into range during the day. However, there are signs that the pair is ready to make a move with possible retest of support.
On the upside, LINK/USDT is facing resistance at $20. This level has been tested today and if the price holds above on the daily close it will be confirmed as support. A break above $20 would signal a bullish breakout and could send the pair higher to $22.
On the downside, LINK/USDT is facing support at $17.6. This level is a previous swing low and has been tested multiple times in recent weeks as big resistance. A break below $17.6 would signal a bearish breakdown and could send the pair lower to $17 or even $16.
LINK chart TW link: https://www.tradingview.com/x/myu03J0j/
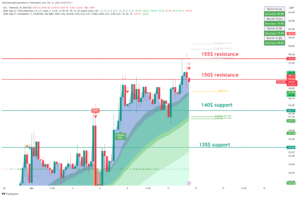
SOL:
INTRO: SOL pushing to 150$ resistance.
Here is a technical analysis of the SOL/USDT chart:
Key Levels:
- Resistance: $135, $126
- Support: $120, 107$
Strategy:
- Long: Buy at $120 with a stop loss below $100 and a target price of $130.
- Short: Sell at $100 with a stop loss above $ 107 and a target price of $90.
Range Description:
SOL/USDT is currently trading in a range between 120$ and 140$. However, there are signs that the pair is ready to make a move to push strong resistance at 150$.
On the upside, SOL/USDT is facing resistance at $135. This level has been tested today and if the price holds above on the daily close it will be confirmed as support. A break above $135 would signal a bullish breakout and could send the pair higher to $150.
On the downside, SOL/USDT is facing support at $120. This level is a previous swing low and has been tested multiple times in recent weeks as big support. A break below $120 would signal a bearish breakdown and could send the pair lower to $100 or even $90.
SOL chart TW link: https://www.tradingview.com/x/pdzeADvC/
CRYPTO NEWS:
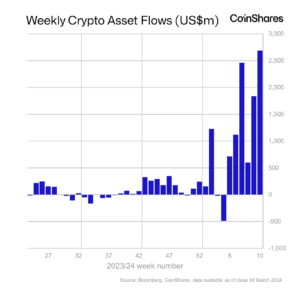
GRAPH OF THE DAY: $2.7B IN WEEKLY INFLOWS
Crypto investment products have been on fire lately…
- 4 weeks ago, they hit $2.45B in inflows. A weekly record at the time.
- Last week, they hit $2.7B in inflows. A new weekly record.
That’s 2 broken records in 4 weeks. (*woogity woogity woogity*)
Here’s everything else you need to know from the latest report:
|
Trader Jake Take: We’ve been tracking these weekly flows for ~2 years now and we’ve never seen numbers like this before. It’s crazy. Just to give you an idea of how crazy, let’s compare last year vs. now. LAST YEAR…
It was like when your shower all of a sudden goes ice cold because someone turned on the dishwasher. NOW…
We’ll see if crypto can continue its red-hot streak this week. Trader Jake Take: We’ve been tracking these weekly flows for ~2 years now and we’ve never seen numbers like this before. It’s crazy. Just to give you an idea of how crazy, let’s compare last year vs. now. LAST YEAR…
It was like when your shower all of a sudden goes ice cold because someone turned on the dishwasher. NOW…
We’ll see if crypto can continue its red-hot streak this week. |
FAST NEWS:
Larry Fink bets Bitcoin ETFs are just the beginning as Wall Street eyes a $10T “tokenization play”. The goal? “The tokenization of every financial asset”. —DL News
Bitcoin’s transaction volume has skyrocketed over the last week. It just hit its highest level in 18 months.
Coinbase surpassed its initial direct listing price ($250) for the first time in 2+ years. The crypto exchange still has a ways to go before it nears a new all-time high ($342).
Wyoming passed a law giving DAOs a nonprofit legal framework. This provides a framework for DAOs of at least 100 members to become unincorporated nonprofit associations. It will go into effect July 1, 2024.
Grayscale and Coinbase met with the SEC to talk about ETH ETFs. Grayscale is in the process of converting its Ethereum Trust into an ETF.
DC Comics is teaming up with Candy Digital to launch a new Batman NFT collection. There will be 11,544 Batman-themed NFTs, celebrating the iconic superhero’s 85th anniversary.
Final words:
CPI come bad we could see support retest.
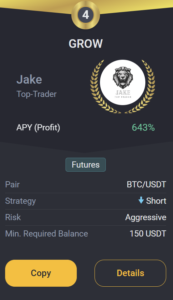
GROW BOT UPDATE:
Copy trade GROW 0.1->10k$ since 18.03.23 we got +219.0% PROFIT!
GROW CURENTLY:
TRADING COIN: BTC/USDT
SETUP: SHORT
TAKE PROFIT: /
SAFETY ORDERS: /
Liquidation: /
Not Financial Advice!
Good luck with trades,
JAKE