Altcoins catching momentum and could push up.
Jake
TOP Trader
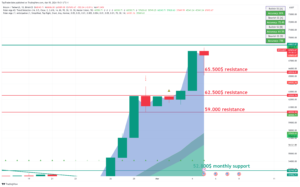
BTC:
INTRO: BTC pushing into 69k resistance.
Technical analysis for the BTC/USDT chart:
Key Levels:
- Resistance: $65,000
- Support: $50,000, $48,200
Strategy:
- Long: Buy at $60,100 with a stop loss below $59,000 and a target price of $63,000.
- Short: Sell at $63,000 with a stop loss above $63,500 and a target price of $60,000.
Range Description:
BTC/USDT is currently trading between $60,000 and $63,000. The pair has broken into the range during the day. However, there are signs that the pair is ready to make a move with a possible retest of support.
On the upside, BTC/USDT is facing resistance at $50,000. The $50,000 level has been tested today, and if the price holds above it on the daily close, it will be confirmed as support. A break above $50,000 would signal a bullish breakout and could send the pair higher to $52,000.
On the downside, BTC/USDT is facing support at $48,500. This level was a previous resistance for the day and is now holding as support. A break below $48,500 would signal a bearish breakdown, sending the pair lower to $45,000 or even $42,000.
BTC1D chart TW link: https://www.tradingview.com/x/MHRVmgd0/
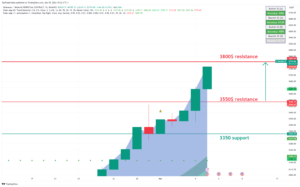
ETH:
INTRO: ETH pushing to 3800$.
Here is a technical analysis of the ETH/USDT chart:
Key Levels:
- Resistance: $3550, $3300
- Support: $3350, $3300
Strategy:
- Long: Buy at $3300 with a stop loss below $3000 and a target price of $3500.
- Short: Sell at $3500 with a stop loss above $3600 and a target price of $3300.
Range Description:
ETH/USDT is currently trading between $3300 and $3500. The pair has broken into the range during the day. However, there are signs that the pair is ready to make a move with a possible retest of support.
On the upside, ETH/USDT is facing resistance at $3500. This level hasn’t been tested today, and if the price holds above it on the daily close, it will be confirmed as support. A break above $3500 would signal a bullish breakout and could send the pair higher to $3600.
On the downside, ETH/USDT is facing support at $3300. This level is a previous swing low and has been tested multiple times in recent weeks as resistance. A break below $3300 would signal a bearish breakdown and could send the pair lower to $3000 or even $2900.
ETH1D chart TW link: https://www.tradingview.com/x/SePR38WE/
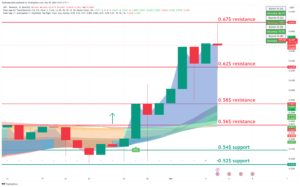
XRP:
INTRO: XRP pushing into 0.67$
Here is a technical analysis of the XRP/USDT chart:
Key Levels:
- Resistance: $0.50, $0.52
- Support: $0.48, $0.46
Strategy:
- Long: Buy at $0.48 with a stop loss below $0.46 and a target price of $0.58.
- Short: Sell at $0.50 with a stop loss above $0.52 and a target price of $0.46.
Range Description:
XRP/USDT is currently trading between $0.48 and $0.52. The pair has shifted into the range during the day. However, there are signs that the pair is ready to make a move with a possible retest of support.
On the upside, XRP/USDT is facing resistance at $0.50. This level has been tested today, and if the price holds above it on the daily close, it will be confirmed as support. A break above $0.50 would signal a bullish breakout and could send the pair higher to $0.52.
On the downside, XRP/USDT is facing support at $0.48. This level is a previous swing low and has been tested multiple times in recent weeks as significant support. A break below $0.48 would signal a bearish breakdown and send the pair lower to $0.46 or even $0.44.
XRP chart TW link: https://www.tradingview.com/x/7PHI1SX7/
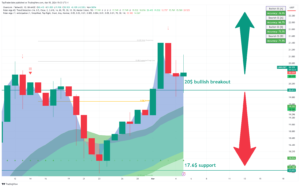
LINK:
INTRO: LINK pushing into 20$.
Here is a technical analysis for the LINK/USDT chart:
Key Levels:
- Resistance: $20
- Support: $17.6
Strategy:
- Long: Buy at $17.6 with a stop loss below $17 and a target price of $20.
- Short: Sell at $20 with a stop loss above $21 and a target price of $17.6.
Range Description:
LINK/USDT is currently trading between $17 and $20. The pair has shifted into the range during the day. However, there are signs that the pair is ready to make a move with a possible retest of support.
On the upside, LINK/USDT is facing resistance at $20. This level has been tested today, and if the price holds above it on the daily close, it will be confirmed as support. A break above $20 would signal a bullish breakout and could send the pair higher to $22.
On the downside, LINK/USDT is facing support at $17.6. This level is a previous swing low and has been tested multiple times in recent weeks as significant resistance. A break below $17.6 would signal a bearish breakdown and could send the pair lower to $17 or even $16.
LINK chart TW link: https://www.tradingview.com/x/duvzBLP3/
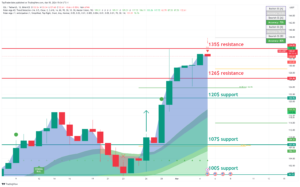
SOL:
INTRO: SOL pushing 135$.
Here is a technical analysis of the SOL/USDT chart:
Key Levels:
- Resistance: $135, $126
- Support: $120, 107$
Strategy:
- Long: Buy at $120 with a stop loss below $100 and a target price of $130.
- Short: Sell at $100 with a stop loss above $ 107 and a target price of $90.
Range Description:
SOL/USDT is currently trading between $120 and $140. However, there are signs that the pair is ready to make a move to push strong resistance at $150.
On the upside, SOL/USDT is facing resistance at $135. This level has been tested today, and if the price holds above it on the daily close, it will be confirmed as support. A break above $135 would signal a bullish breakout and could send the pair higher to $150.
On the downside, SOL/USDT is facing support at $120. This level is a previous swing low and has been tested multiple times in recent weeks as significant support. A break below $120 would signal a bearish breakdown and could send the pair lower to $100 or even $90.
SOL chart TW link: https://www.tradingview.com/x/dv6PZjzz/
CRYPTO NEWS:
Crypto funds are seeing massive inflows
The results from CoinShares’ latest report are in…
$1.84B was invested in digital asset investment products last week.
It’s the 2nd largest weekly inflow on record.
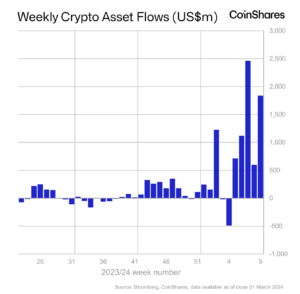
Here’s everything else you need to know from the report:
- Trading volumes hit $30B, a new weekly record.
- BTC saw 94% of the investments.
- ETH saw $85M in total inflows, the largest weekly inflow since July 2022.
- Assets under management (AUM) hit $82.6B, and are close to reaching a new all-time. (It was ~$86B back in 2021).
- Most altcoins saw minor inflows. MATIC led the way with ~$8M, while SOL saw minor outflows for the 3rd straight week.
We’ll see what’s in store this week, but I have a feeling* it could be another record-breaker.
Bitcoin is dominating the NFT market
It’s official. The NFT market has gone multi-chain…
5 blockchains have seen over $1M in NFT volume over the last 24 hours.
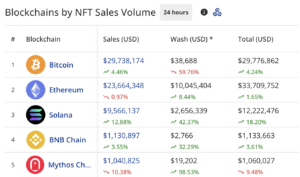
The surprising part? Bitcoin is leading the way.
The OG blockchain has almost seen as much NFT volume as the other 4 blockchains… combined!
FAST NEWS:
A crypto exchange in Hong Kong disappeared with $57M last week. The surprising part? The “company’s address” leads to an empty office in a strip mall. – DL News.
This CryptoPunk NFT just sold for 4,500 ETH (worth $16M). It’s the second-largest CryptoPunk sale ever.
Crypto stocks are surging as BTC approaches a new all-time high. Coinbase, MicroStrategy, CleanSpark, Marathon Digital, and others were all up over 5% in pre-market trading today.
Memecoins continued their rally over the weekend. The biggest winners? $PEPE, $DOGE, $BONK, and $WIF.
Tether’s stablecoin (USDT) just hit a circulating supply of 100B tokens. The total USDT supply (including those minted and authorized) amounted to 104 billion as of Monday, according to data from The Block.
Final words:
BTC checking resistance will it manage to break it.
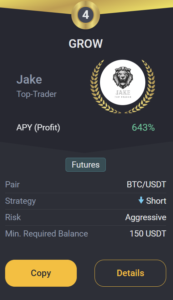
GROW BOT UPDATE:
Copy trade GROW 0.1->10k$ since 18.03.23 we got +219.0% PROFIT!
GROW CURRENTLY:
TRADING COIN: BTC/USDT
SETUP: SHORT
TAKE PROFIT: /
SAFETY ORDERS: /
Liquidation: /
Not Financial Advice!
Good luck with trades,
JAKE