

ETH still fighting 3800$ resistance
Jake
TOP Trader
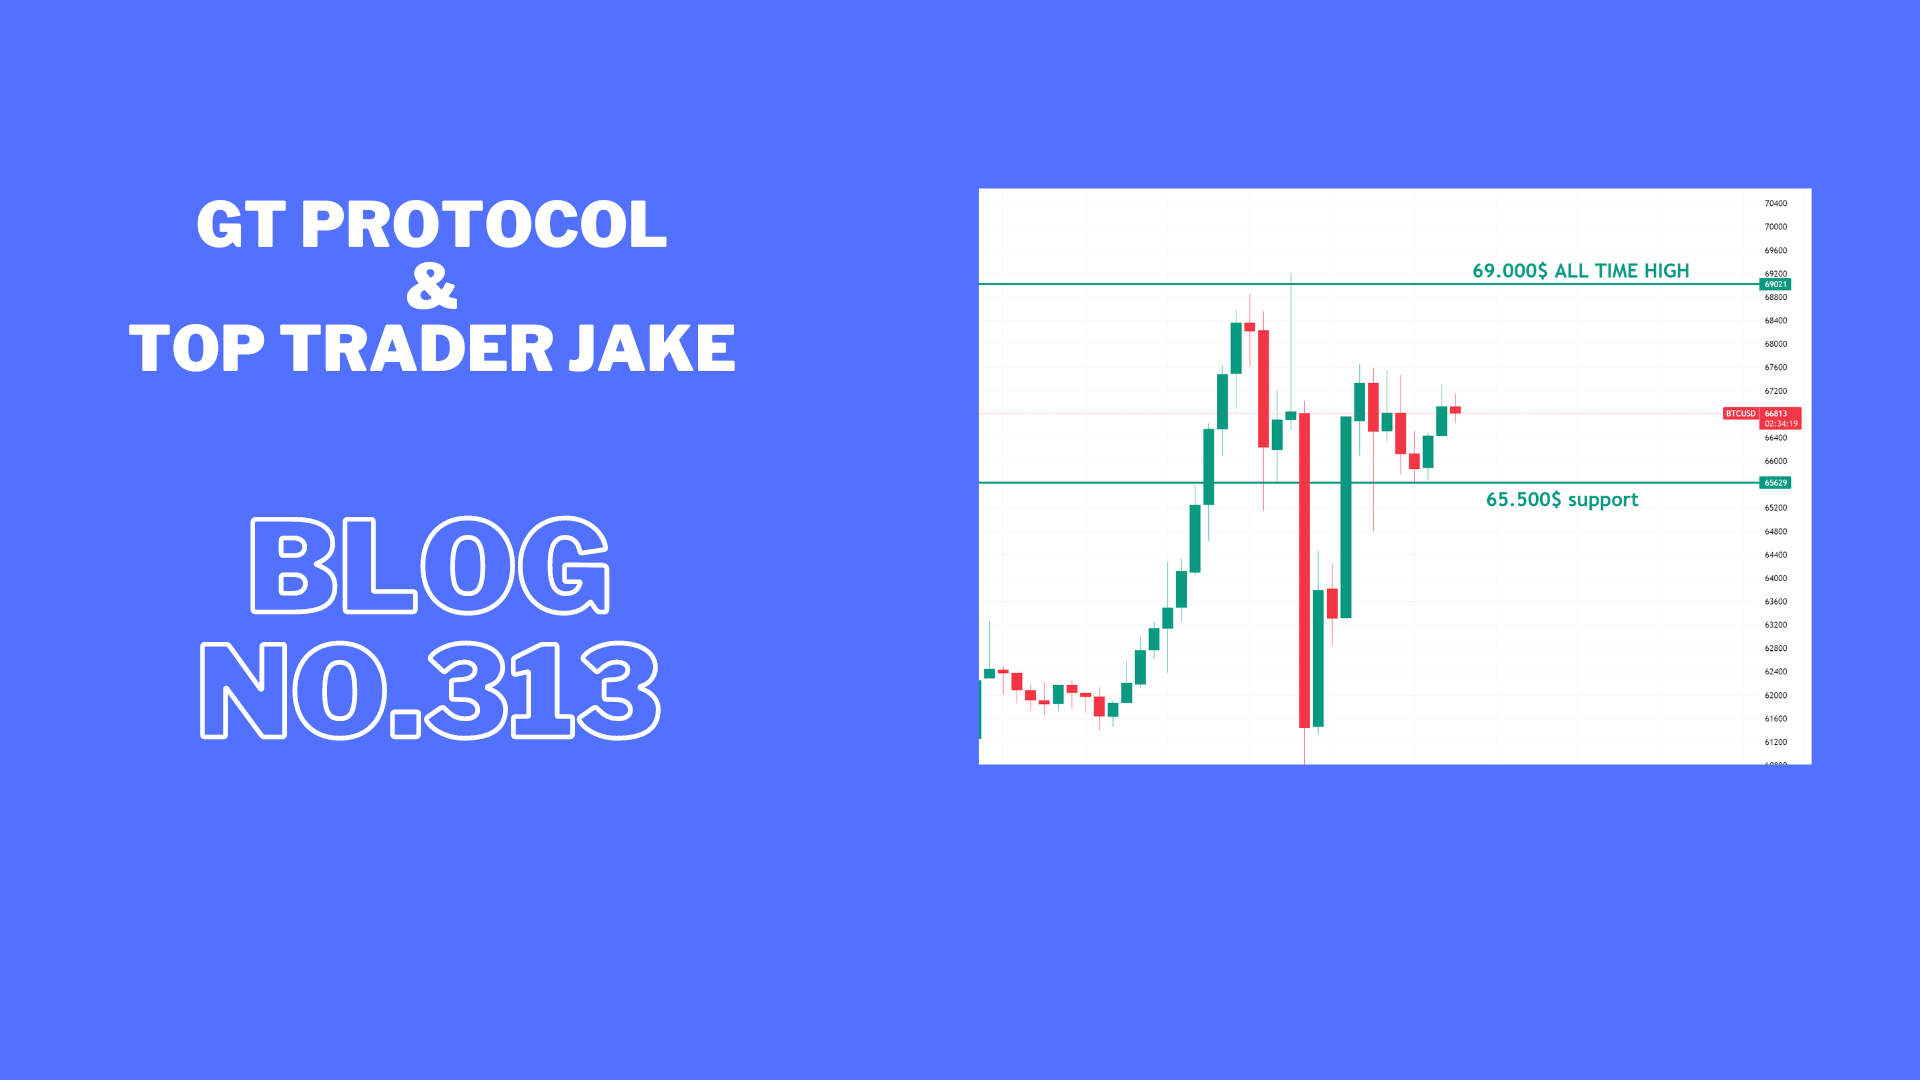
BTC:
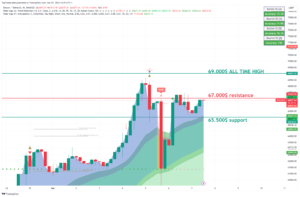
INTRO: BTC consolidating above 66k.
Technical analysis for the BTC/USDT chart:
Key Levels:
- Resistance: $65,000
- Support: $50,000, $48,200
Strategy:
- Long: Buy at $60,100 with a stop loss below $59,000 and a target price of $63,000.
- Short: Sell at $63,000 with a stop loss above $63,500 and a target price of $60,000.
Range Description:
BTC/USDT is currently trading between $60,000 and $63,000. The pair has broken into the range during the day. However, there are signs that the pair is ready to make a move with a possible retest of support.
On the upside, BTC/USDT is facing resistance at $50,000. The $50,000 level has been tested today, and if the price holds above the daily close, it will be confirmed as support. A break above $50,000 would signal a bullish breakout and could send the pair higher to $52,000.
On the downside, BTC/USDT is facing support at $48,500. This level was a previous resistance for the day and now holds as support. A break below $48,500 would signal a bearish breakdown, sending the pair lower to $45,000 or even $42,000.
BTC1D chart TW link: https://www.tradingview.com/x/SBL7yJF0/
ETH:
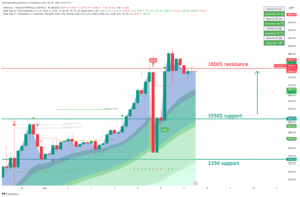
INTRO: ETH pushing to 3800$.
Here is a technical analysis of the ETH/USDT chart:
Key Levels:
- Resistance: $3550, $3300
- Support: $3350, $3300
Strategy:
- Long: Buy at $3300 with a stop loss below $3000 and a target price of $3500.
- Short: Sell at $3500 with a stop loss above $3600 and a target price of $3300.
Range Description:
ETH/USDT is currently trading between $3300 and $3500. The pair has broken into the range during the day. However, there are signs that the pair is ready to make a move with a possible retest of support.
On the upside, ETH/USDT is facing resistance at $3500. This level hasn’t been tested today, and if the price holds above the daily close, it will be confirmed as support. A break above $3500 would signal a bullish breakout and could send the pair higher to $3600.
On the downside, ETH/USDT is facing support at $3300. This level is a previous swing low and has been tested multiple times in recent weeks as resistance. A break below $3300 would signal a bearish breakdown and could send the pair lower to $3000 or even $2900.
ETH1D chart TW link: https://www.tradingview.com/x/M45TukQt/
XRP:
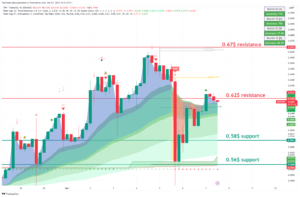
INTRO: XRP pushing into 0.62$.
Here is a technical analysis of the XRP/USDT chart:
Key Levels:
- Resistance: $0.50, $0.52
- Support: $0.48, $0.46
Strategy:
- Long: Buy at $0.48 with a stop loss below $0.46 and a target price of $0.58.
- Short: Sell at $0.50 with a stop loss above $0.52 and a target price of $0.46.
Range Description:
XRP/USDT is currently trading between $0.48 and $0.52. The pair has shifted into the range during the day. However, there are signs that the pair is ready to make a move with a possible retest of support.
On the upside, XRP/USDT is facing resistance at $0.50. This level has been tested today, and if the price holds above the daily close, it will be confirmed as support. A break above $0.50 would signal a bullish breakout and could send the pair higher to $0.52.
On the downside, XRP/USDT is facing support at $0.48. This level is a previous swing low and has been tested multiple times in recent weeks as significant support. A break below $0.48 would signal a bearish breakdown and could send the pair lower to $0.46 or even $0.44.
XRP chart TW link: https://www.tradingview.com/x/mdlg4XSU/
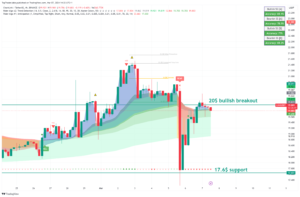
LINK:
INTRO: LINK pushing into 20$.
Here is a technical analysis for the LINK/USDT chart:
Key Levels:
- Resistance: $20
- Support: $17.6
Strategy:
- Long: Buy at $17.6 with a stop loss below $17 and a target price of $20.
- Short: Sell at $20 with a stop loss above $21 and a target price of $17.6.
Range Description:
LINK/USDT is currently trading between $17 and $20. The pair has shifted into the range during the day. However, there are signs that the pair is ready to make a move with a possible retest of support.
On the upside, LINK/USDT is facing resistance at $20. This level has been tested today, and if the price holds above the daily close, it will be confirmed as support. A break above $20 would signal a bullish breakout and could send the pair higher to $22.
On the downside, LINK/USDT is facing support at $17.6. This level is a previous swing low and has been tested multiple times in recent weeks as significant resistance. A break below $17.6 would signal a bearish breakdown and could send the pair lower to $17 or even $16.
LINK chart TW link: https://www.tradingview.com/x/2XsN70KC/
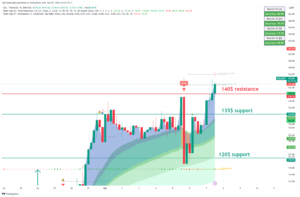
SOL:
INTRO: SOL pushing above 140$.
Here is a technical analysis of the SOL/USDT chart:
Key Levels:
- Resistance: $135, $126
- Support: $120, 107$
Strategy:
- Long: Buy at $120 with a stop loss below $100 and a target price of $130.
- Short: Sell at $100 with a stop loss above $ 107 and a target price of $90.
Range Description:
SOL/USDT is currently trading between $120 and $140. However, there are signs that the pair is ready to make a move to push strong resistance at $150.
On the upside, SOL/USDT is facing resistance at $135. This level has been tested today, and if the price holds above the daily close, it will be confirmed as support. A break above $135 would signal a bullish breakout and could send the pair higher to $150.
On the downside, SOL/USDT is facing support at $120. This level is a previous swing low and has been tested multiple times in recent weeks as significant support. A break below $120 would signal a bearish breakdown and could send the pair lower to $100 or even $90.
SOL chart TW link: https://www.tradingview.com/x/DNhjuOhk/
CRYPTO NEWS:
COINBASE ENTERS THE TOP 50
LOOK! Up in the sky…
Person 1: “It’s a bird!”
Person 2: “No! It’s a plane!”
Milk Man: “Nah, that’s just Coinbase flying through the App Store!”
That’s right. The U.S. crypto exchange has been on a roll lately…
It started the year ranked #489. AKA “participation ribbon” status.
Today, it’s ranked #49.
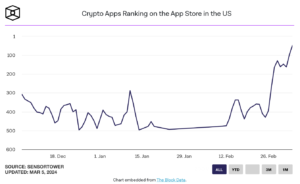
Why this matters: It’s the first time Coinbase has been ranked in the Top 50 since February 2022.
Retail is back, baby!
COMING SOON: MORE VOLATILITY
Check it out. There’s something called the “DVOL Index.”
The index was created by the crypto exchange Deribit.
It’s calculated using the exchange’s option order book and tries to predict BTC’s volatility over the next 30 days.
Well, the DVOL has jumped from 40% → 76% over the last month.
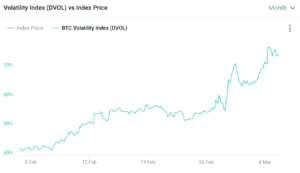
Buckle up. It looks like we could be in for some volatility over the next month.
Remember, crypto is like a mechanical bull at a bar. It’s all fun and games till the bull throws the drunk girl off and she pukes.
FAST NEWS:
ETH has just reached $3,800 for the first time since the end of 2021. What triggered this sudden rally? Ethereum’s upcoming upgrade, Dencun, is scheduled for next week.
Coachella is set to launch a new NFT collection, granting fans access to VIP areas and exclusive merchandise at this year’s event through the NFTs.
The total value locked (TVL) in DeFi protocols has surpassed $100B for the first time in approximately two years. Business is thriving!
Bitcoin ETFs experienced $9.5B in trading volume yesterday, marking a new all-time high. Another week, another broken record.
Binance has added $WIF, a popular Solana memecoin, to its trading platform. The meme coin has surged by 50% and achieved a new all-time high.
MetaMask is partnering with Revolut to simplify the process of buying crypto. Users can utilize Revolut Ramp to directly make crypto purchases into their MetaMask wallets.
Final words:
The market pushed up and now consolidated under resistance. Take your positions for the next push.
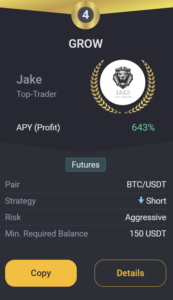
GROW BOT UPDATE:
Copy trade GROW 0.1->10k$ since 18.03.23 we got +219.0% PROFIT!
GROW CURRENTLY:
TRADING COIN: BTC/USDT
SETUP: SHORT
TAKE PROFIT: /
SAFETY ORDERS: /
Liquidation: /
Not Financial Advice!
Good luck with trades,
JAKE