

The new year will start with hype, we may see new highs and a breakout of major resistance.
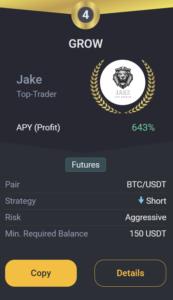
Jake
TOP Trader
BTC:
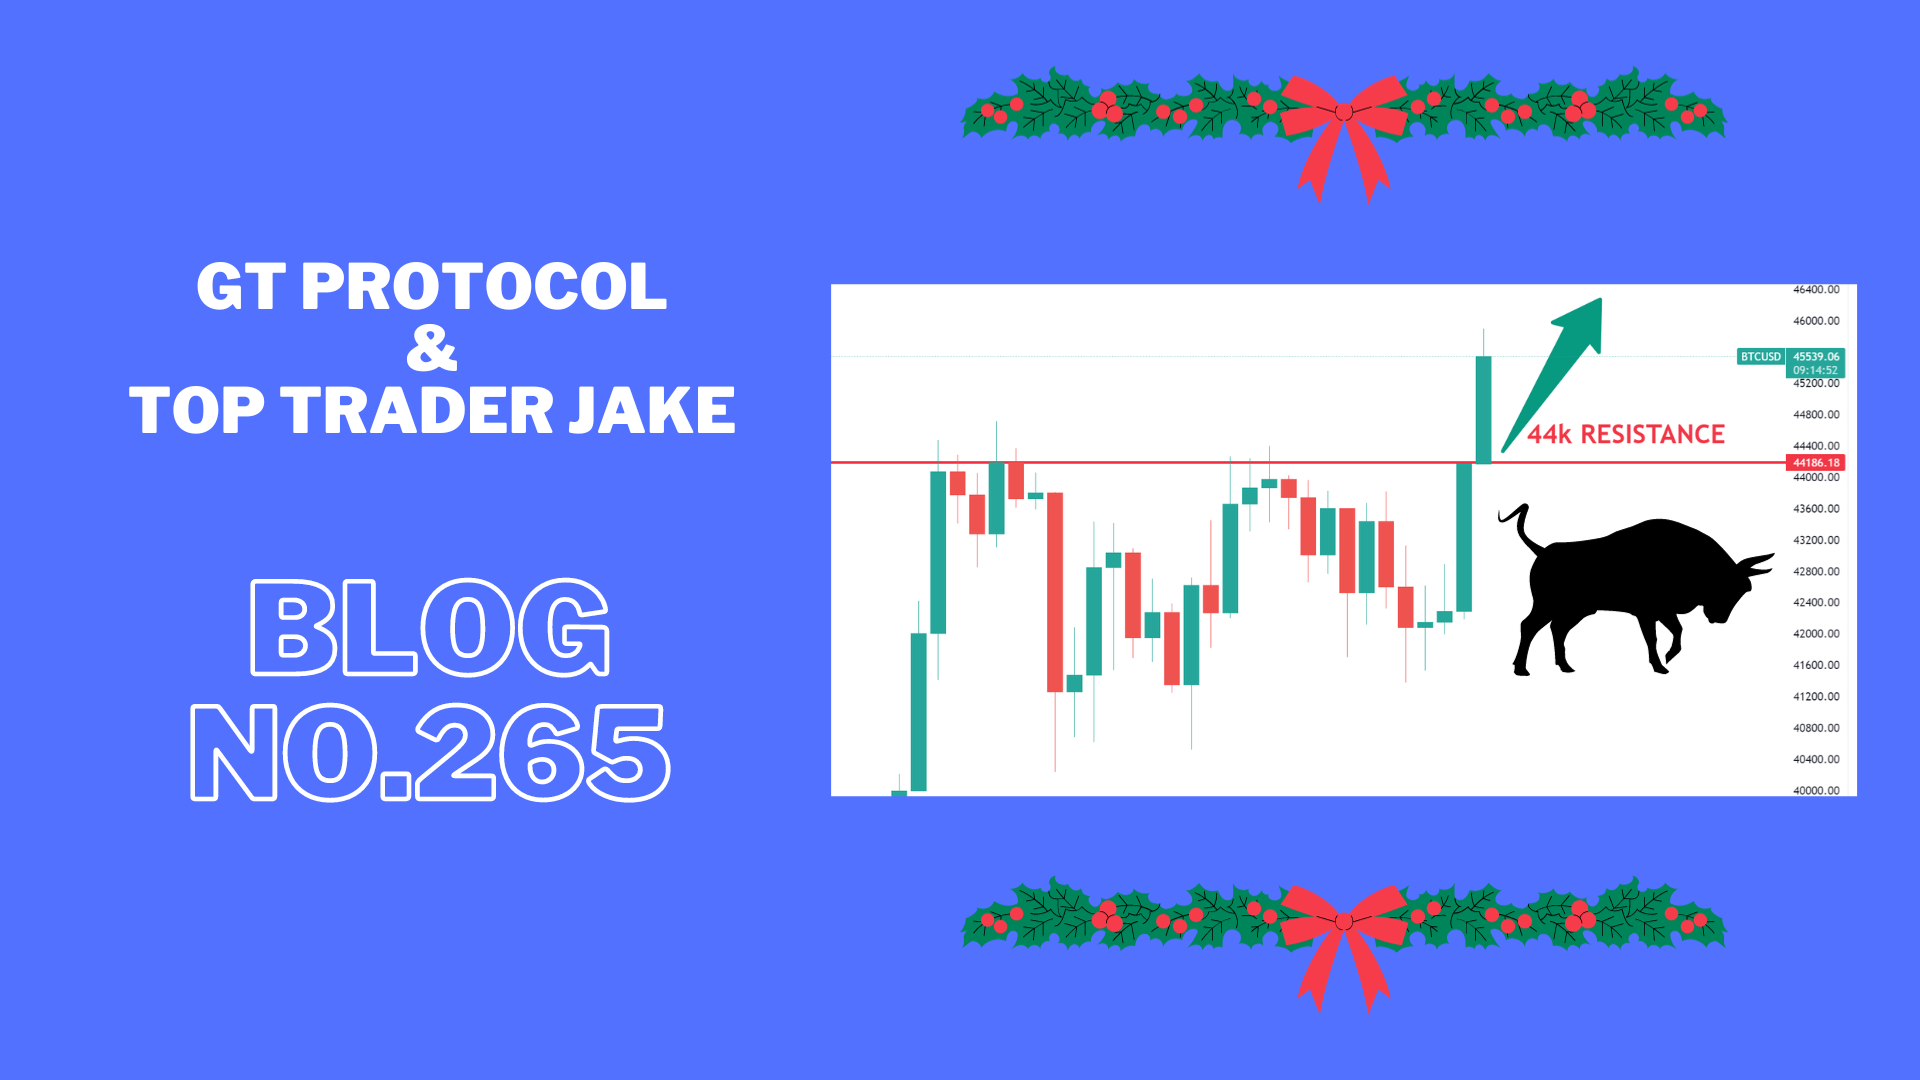
INTRO: BTC breaks strong resistance at 44k.
Technical analysis for the BTC/USDT chart:
Key Levels:
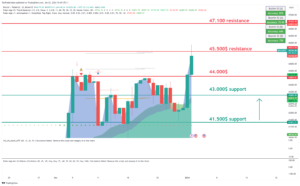
- Resistance: $45,500, $44,000
- Support: $43,000, $41,500
Strategy:
- Long: Buy at $43.000 with a stop loss below $40,000 and a target price of $45,500.
- Short: Sell at $44,000 with a stop loss above $45,500 and a target price of $40,000.
Range description:
BTC/USDT is currently trading in a range between $40,500 and $45,000. The pair has broken into the range during the day. However, there are signs that the pair is ready to make a move with a possible retest of support.
On the upside, BTC/USDT is facing resistance at $44,000. The $43,000 level has been tested today, and if the price holds above it on the daily close, it will be confirmed as support. A break above $43,000 would signal a bullish breakout and could send the pair higher to $45,500.
On the downside, BTC/USDT is facing support at $41,500. This level was a previous resistance for the day and now holds as support. A break below $40,000 would signal a bearish breakdown and could send the pair lower to $37,000 or even $35,000.
BTC1D chart TW link: https://www.tradingview.com/x/jaL6kbpx/
ETH:
INTRO: ETH is charged to a resistance of $2400.
Here is a technical analysis for the ETH/USDT chart:
Key Levels:
- Resistance: $2320, $2420
- Support: $2220, $2100
Strategy:
- Long: Buy at $2220 with a stop loss below $2100 and a target price of $2420.
- Short: Sell at $2420 with a stop loss above $2520 and a target price of $2100.
Range description:
ETH/USDT is currently trading in a range between $2100 and $2400. The pair has broken into the range during the day. However, there are signs that the pair is ready to make a move with a possible retest of support.
On the upside, ETH/USDT is facing resistance at $2420. This level hasn’t been tested today, and if the price holds above it on the daily close, it will be confirmed as support. A break above $2420 would signal a bullish breakout and could send the pair higher to $2520.
On the downside, ETH/USDT is facing support at $2320. This level is a previous swing low and has been tested multiple times in recent weeks as resistance. A break below $2320 would signal a bearish breakdown and could send the pair lower to $2220 or even $2000.
ETH1D chart TW link: https://www.tradingview.com/x/loA4S6zs/
XRP:
INTRO: XRP is trying to hold above $0.62 for a bigger push upwards with a high probability of a pullback.
Here is a technical analysis for the XRP/USDT chart:
Key Levels:
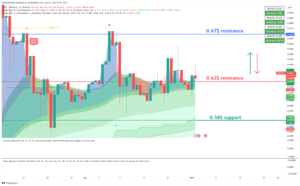
- Resistance: $0.62, $0.67
- Support: $0.58, $0.54
Strategy:
- Long: Buy at $0.62 with a stop loss below $0.58 and a target price of $0.67.
- Short: Sell at $0.62 with a stop loss above $0.67 and a target price of $0.58.
Range description:
XRP/USDT is currently trading in a range between $0.58 and $0.67. The pair has shifted into the range during the day. However, there are signs that the pair is ready to make a move with a possible retest of support.
On the upside, XRP/USDT is facing resistance at $0.66. This level has been tested today, and if the price holds above on the daily close, it will be confirmed as support. A break above $0.67 would signal a bullish breakout and could send the pair higher to $0.7.
On the downside, XRP/USDT is facing support at $0.62. This level is a previous swing low and has been tested multiple times in recent weeks as significant support. A break below $0.62 would signal a bearish breakdown and could send the pair lower to $0.58 or even $0.54.
XRP chart TW link: https://www.tradingview.com/x/iTZ3asKT/
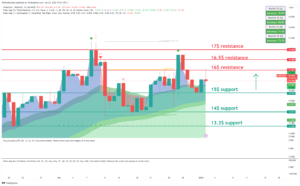
LINK:
INTRO: LINK is trying to break through the $17 resistance and continue the bullish move upwards.
Here is a technical analysis for the LINK/USDT chart:
Key Levels:
- Resistance: $16.5, $16
- Support: $15, $14
Strategy:
- Long: Buy at $15 with a stop loss below $14 and a target price of $17.
- Short: Sell at $16.5 with a stop loss above $17.5 and a target price of $14.
Range description:
LINK/USDT is currently trading in a range between $16 and $17. The pair has shifted into the range during the day. However, there are signs that the pair is ready to make a move with a possible retest of support.
On the upside, LINK/USDT is facing resistance at $17. This level has been tested today, and if the price holds above on the daily close, it will be confirmed as support. A break above $17 would signal a bullish breakout and could send the pair higher to $18.
On the downside, LINK/USDT is facing support at $16. This level is a previous swing low and has been tested multiple times in recent weeks as significant resistance. A break below $16 would signal a bearish breakdown and could send the pair lower to $13 or even $14.
LINK chart TW link: https://www.tradingview.com/x/EfWbZBPP/
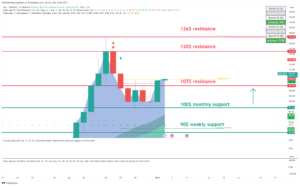
SOL:
INTRO: SOL is pushing for a bullish breakout.
Here is a technical analysis for the SOL/USDT chart:
Key Levels:
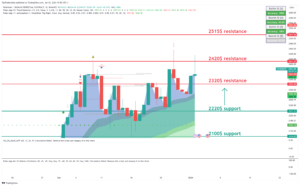
- Resistance: $107, $120
- Support: $90, 100$
Strategy:
- Long: Buy at $100 with a stop loss below $90 and a target price of $120.
- Short: Sell at $107 with a stop loss above $120 and a target price of $100.
Range description:
SOL/USDT is currently trading in a range between $100 and $126. However, there are signs that the pair is ready to make a move to push through strong resistance at $120.
On the upside, SOL/USDT is facing resistance at $107. This level has been tested today, and if the price holds above on the daily close, it will be confirmed as support. A break above $107 would signal a bullish breakout and could send the pair higher to $126.
On the downside, SOL/USDT is facing support at $100. This level is a previous swing low and has been tested multiple times in recent weeks as significant support. A break below $100 would signal a bearish breakdown and could send the pair lower to $90 or even $80.
SOL chart TW link: https: https://www.tradingview.com/x/3rKk2d1p/
CRYPTO NEWS:
SOLAN MEMCOIN TRADING LESSONS
All right. First of all. why did I decide to start trading memcoins in Solana?
Here are 3 reasons that aren’t called “it’s all about the money”:
1/ There has been a lot of hype around Solana tokens lately. It’s like hearing music in your neighbour’s house, and you’re just sitting in your house knitting….
At some point you have to put the yarn aside and go look at the party.
2/ I wanted to see how things were going with trading on Solana. I used it back in 2021, but stopped last year after all the outages and drama. Plus, I was getting pwned there with the NFT project.
I was finally ready to give it a *second chance*.
3/ Okay, fine… it’s partly about the money. After I wrote about traders who turned $16K → $12M and $50 → $100K… I smelled the stench of degeneration and wanted to give it a try.
Side note: this degenerate move was also sponsored by….. by my wife’s grandmother, Nana.
This was the first Christmas I became a “husband”. And for the past 5 years, I’ve received a “boyfriend Christmas present” (fresh socks and white t-shirts) from Nana.
This year I got married and made it to the big leagues (fresh socks, white t-shirts and $250). The gift came with a note that said, “Use this to buy more dog coins.”
By the way, I’m not going to focus on which token I bought. Why? Because, frankly, it doesn’t matter.
After all, it’s a shit token. And I’m not here to promote it. I’m here to tell you about the lessons.
Let’s dive in.
1/ Working with Solana was fast, cheap and convenient.
The first thing that caught the eye was. cheap petrol fees.
I’ve historically used Ethereum, where petrol fees can reach triple digits ($100+) when the network is busy. You can’t tell if you’re buying something on Ethereum or Ticketmaster….
Solana’s commission (on average) is less than $0.01.
2/ Know your role and play it.
I am a worthless day trader. I don’t have the time, skills, or patience for it.
There, I’ve said it.
And honestly. I’d rather stare at the sun for 9 hours straight than stare at charts all day. That’s what my experience looked like:
I looked at the chart… the price is up 30%.
Go to the toilet… price drops 40%.
Take a sip of coffee… price goes up again by 20%.
(At one point I was convinced that every time I drank coffee, the price would go up. I would run upstairs, drink the rest of my coffee, come back downstairs and….. the price was down 25% ?).
It was at that moment that I realised it wasn’t for me. And that’s okay… There are plenty of other ways to make money with cryptocurrency.
Stick to your strengths and your favourite stories. (DeFi, staking, yield, NFT, etc).
3/ Beware of the prophets of profit
One of the main reasons I bought Solana-Memecoin-Who-Must-Not-Be-Named is this.
I’ve noticed that a lot of people I follow on social media are talking about him.
Discord. Twitter. It was all over the place. And it was people I trusted.
But I realised that some of it was coordinated throw-ins…..
Pic:meme
Be careful not to get caught up in the mess and…
4/ Don’t be blind to counterarguments.
A big mistake investors make is to look at the bullish views on the coin and dismiss the negative ones as “coping/fudding”.
(Fudding = spreading fear, uncertainty and doubt).
A Twitter user (@FreddieRaynolds) explained how Luna could collapse. People scoffed and laughed at it, but a few months later….. Luna collapsed.
Ishaan Bhaidani called FTX a fraudulent company. People mocked and laughed at him, but a few months later, … FTX collapsed.
Lesson: Look at the bullish and bearish forecasts and make your own decision.
Okay, this is getting a little long, and my editor looks like he’s going to hit me with the force of 1,000 Will Smiths if I continue.
FAST NEWS:
- Significant Bitcoin Movement: Bitcoin saw a significant uptick, breaking the $45,000 mark for the first time in nearly two years. This upward momentum has led to the liquidation of millions of short positions and has left the cryptocurrency community in an upbeat mood. The market is also speculating on bitcoin’s bullish future as it continues to dominate with a market value of around $900 billion and dominates altcoins by 50.9 per cent. Solana (SOL) and Avalanche (AVAX) are among the altcoins that have seen double-digit growth.
- Historic bitcoin exodus: A significant amount of bitcoin, totalling around $1.2 billion, has been withdrawn from centralised exchanges, marking the largest outflow since December 2022. This is indicative of a growing trend of investors choosing to hold their coins for the long term, which led to bitcoin’s lowest balance on exchanges since April 2018.
Spot bitcoin ETF development: The cryptocurrency market is carefully awaiting the US Securities and Exchange Commission’s (SEC) decision to approve spot bitcoin ETFs. Various asset management firms are vying for regulatory approval, which could have significant implications for the market. Coinbase has announced that its systems are ready to facilitate BTC storage for ETF issuers, positioning itself as a custodian for potential ETFs.
- Celsius Network’s bitcoin mining plans: A U.S. bankruptcy judge has approved Celsius Network’s move into bitcoin mining, allowing the company to change its bankruptcy plan and possibly marking a new direction in its restructuring efforts.
- SwissX XRP Green: The SwissX XRP token is attracting attention as a green option in the cryptocurrency space. Linked to the audited value of coral field farming practices, it promotes sustainable agriculture and generates Blue Standard carbon credits backed by the government of Antigua and Barbuda.
Final words:
Market pushing strong with new year open and showing bullish momentum.
Lets take best trading opportunities for coming bull market and grow your trading positions strong.
GROW BOT UPDATE:
Copy trade GROW 0.1->10k$ since 18.03 we got +196.0% PROFIT!
GROW CURENTLY:
TRADING COIN: BTC/USDT
SETUP: SHORT
TAKE PROFIT: /
SAFETY ORDERS: /
Liquidation: /
Not Financial Advice!
Good luck with trades,
JAKE