

ETH follows step down looking for support.
Jake
TOP Trader
BTC:
INTRO: BTC retesting 65.500$.
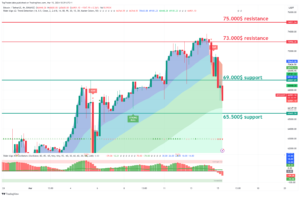
Technical analysis for the BTC/USDT chart:
Key Levels:
- Resistance: $75.000,$72.500
- Support: $69,000, $67,200
Strategy:
- Long: Buy at $69,100 with a stop loss below $65,000 and a target price of $75,000.
- Short: Sell at $75,000 with a stop loss above $77,500 and a target price of $69,000.
Range Description:
BTC/USDT is currently trading in a range between $67,000 and $73,000. The pair has broken into this range during the day. However, there are signs that the pair is ready to make a move with a possible retest of support.
On the upside, BTC/USDT is facing resistance at $73,000. The $73,000 level has been tested today, and if the price holds above it on the daily close, it will be confirmed as support. A break above $73,000 would signal a bullish breakout and could send the pair higher to $80,000.
On the downside, BTC/USDT is facing support at $48,500. This level was a previous resistance during the day and is now holding as support. A break below $48,500 would signal a bearish breakdown, sending the pair lower to $45,000 or even $42,000.
BTC1D chart TW https://www.tradingview.com/x/A4yA4mvl/
ETH:
INTRO: ETH retesting 3550$ support.
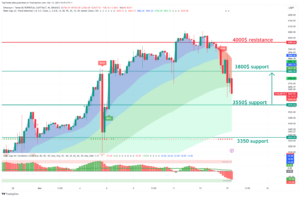
Here is a technical analysis of the ETH/USDT chart:
Key Levels:
- Resistance: $4000, $3800
- Support: $3700, $3600
Strategy:
- Long: Buy at $3700 with a stop loss below $3600 and a target price of $4000.
- Short: Sell at $4000 with a stop loss above $4100 and a target price of $3800.
Range Description:
ETH/USDT is currently trading in a range between $3,800 and $4,000. The pair has broken into this range during the day. However, there are signs that the pair is ready to make a move with a possible retest of support.
On the upside, ETH/USDT is facing resistance at $4,000. This level hasn’t been tested today, and if the price holds above it on the daily close, it will be confirmed as support. A break above $4,000 would signal a bullish breakout and could send the pair higher to $4,100.
On the downside, ETH/USDT is facing support at $3,800. This level is a previous swing low and has been tested multiple times in recent weeks as resistance. A break below $3,800 would signal a bearish breakdown and could send the pair lower to $3,700 or even $3,600.
ETH1D chart TW link: https://www.tradingview.com/x/qEEmwKIV/
XRP:
INTRO: XRP retesting 0.6$ support.
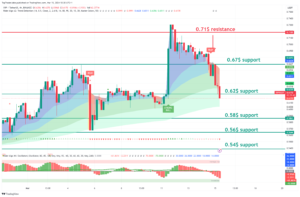
Here is a technical analysis of the XRP/USDT chart:
Key Levels:
- Resistance: $0.70, $0.67
- Support: $0.62, $0.64
Strategy:
- Long: Buy at $0.67 with a stop loss below $0.62 and a target price of $0.78.
- Short: Sell at $0.72 with a stop loss above $0.74 and a target price of $0.62.
Range Description:
XRP/USDT is currently trading in a range between $0.62 and $0.72. The pair has shifted into this range during the day. However, there are signs that the pair is ready to make a move with a possible retest of support.
On the upside, XRP/USDT is facing resistance at $0.70. This level has been tested today, and if the price holds above it on the daily close, it will be confirmed as support. A break above $0.70 would signal a bullish breakout and could send the pair higher to $0.72.
On the downside, XRP/USDT is facing support at $0.67. This level is a previous swing low and has been tested multiple times in recent weeks as significant support. A break below $0.67 would signal a bearish breakdown, sending the pair lower to $0.62 or even $0.60.
XRP chart TW link: https://www.tradingview.com/x/UxP3NDdI/
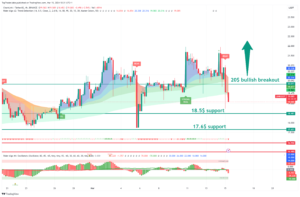
LINK:
INTRO: LINK retest support at 18.5$.
Here is a technical analysis for the LINK/USDT chart:
Key Levels:
- Resistance: $20
- Support: $17.6
Strategy:
- Long: Buy at $17.6 with a stop loss below $17 and a target price of $20.
- Short: Sell at $20 with a stop loss above $21 and a target price of $17.6.
Range Description:
LINK/USDT is currently trading in a range between $17 and $20. The pair has shifted into this range during the day. However, there are signs that the pair is ready to make a move with a possible retest of support.
On the upside, LINK/USDT is facing resistance at $20. This level has been tested today, and if the price holds above it on the daily close, it will be confirmed as support. A break above $20 would signal a bullish breakout and could send the pair higher to $22.
On the downside, LINK/USDT is facing support at $17.6. This level is a previous swing low and has been tested multiple times in recent weeks as significant resistance. A break below $17.6 would signal a bearish breakdown and could send the pair lower to $17 or even $16.
LINK chart TW link: https://www.tradingview.com/x/ihIS5jHl/
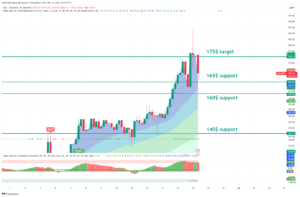
SOL:
INTRO: SOL retest 165$ support.
Here is a technical analysis of the SOL/USDT chart:
Key Levels:
- Resistance: $135, $126
- Support: $120, 107$
Strategy:
- Long: Buy at $120 with a stop loss below $100 and a target price of $130.
- Short: Sell at $100 with a stop loss above $ 107 and a target price of $90.
Range Description:
SOL/USDT is currently trading in a range between $120 and $140. However, there are signs that the pair is ready to make a move to push against strong resistance at $150.
On the upside, SOL/USDT is facing resistance at $135. This level has been tested today, and if the price holds above it on the daily close, it will be confirmed as support. A break above $135 would signal a bullish breakout and could send the pair higher to $150.
On the downside, SOL/USDT is facing support at $120. This level is a previous swing low and has been tested multiple times in recent weeks as significant support. A break below $120 would signal a bearish breakdown and could send the pair lower to $100 or even $90.
SOL chart TW link: https://www.tradingview.com/x/LXyE15vK/
CRYPTO NEWS:
GRAPH OF THE DAY: L2 FEES DROPPED BY 99%
Eth has a historic day.
Ethereum completed its ‘Dencun’ upgrade.
The result? Gas fees on Ethereum Layer 2 (L2s) have plummeted by 99%.
Check it out…
- Before the upgrade… gas fees on popular L2s like Optimism, Base, and Zora cost ~$1.
- After the upgrade… gas fees dropped to less than $0.01.
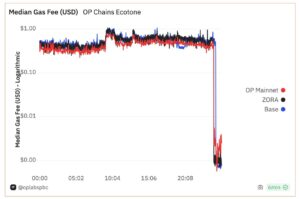
Why this matters: Gas fees on Ethereum are like going to a fancy restaurant – everything’s fine and dandy until you find out the water costs more than the steak.
The Dencun upgrade changed this and will help Ethereum L2s stay competitive with other low-fee networks.
FAST NEWS:
Bernstein predicts crypto’s market cap could hit $7.5T by 2025. The broker expects BTC to grow to a $3T market cap and ETH to jump to a $1.8T market cap.
MicroStrategy is looking to raise $500M. The software firm plans to offer $500M worth of convertible senior notes to institutional buyers to buy more BTC.
Block launched its new self-custodial Bitcoin wallet, Bitkey. The rock-like crypto wallet (yes, it looks like a rock) is being shipped to customers who preordered the product last year.
Crypto funds have seen $12B in total inflows in 2024 – a new yearly record. The crazy part? We’re not even 25% through the year.
$250M in tokens will be unlocked by the end of March. ApeCoin, IMX, Pixel, and Yield Guild Games are all scheduled to unlock tokens over the next 2 weeks.
NFTs are bleeding. 4 out of the top 5 NFT collections have dumped between 20% – 40% over the last week. Yikes.
Final words:
Check the support line for the new long setup and catch these dips.
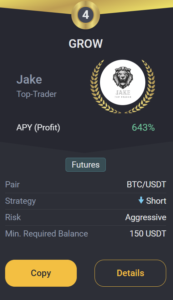
GROW BOT UPDATE:
Copy trade GROW 0.1->10k$ since 18.03.23 we got +219.0% PROFIT!
GROW CURRENTLY:
TRADING COIN: BTC/USDT
SETUP: SHORT
TAKE PROFIT: /
SAFETY ORDERS: /
Liquidation: /
Not Financial Advice!
Good luck with trades,
JAKE