

BTC makes another push towards 44k resistance, will altcoins follow?
Jake
TOP Trader
BTC:
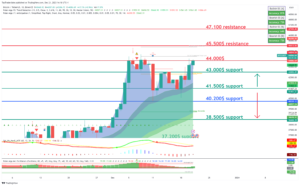
INTRO: BTC is pushing 44k – strong resistance.
Technical analysis for the BTC/USDT chart:
Key Levels:
- Resistance: $45,500, $44,000
- Support: $43,000, $41,500
Strategy:
- Long: Buy at $43.000 with a stop loss below $40,000 and a target price of $45,500.
- Short: Sell at $44,000 with a stop loss above $45,500 and a target price of $40,000.
Range description:
BTC/USDT is currently trading in a range between $40,500 and $44,000. The pair broke into this range during the day. However, there are signs that the pair is ready to make a move with a possible retest of support.
On the upside, BTC/USDT is facing resistance at $44,000. The $43,000 level has been tested today, and if the price holds above it on the daily close, it will be confirmed as support. A break above $43,000 would signal a bullish breakout and could send the pair higher to $45,500.
On the downside, BTC/USDT is facing support at $41,500. This level was a previous resistance for the day and is now holding as support. A break below $40,000 would signal a bearish breakdown and could send the pair lower to $37,000 or even $35,000.
BTC1D chart TW link: https://www.tradingview.com/x/zHlYWrzy/
ETH:
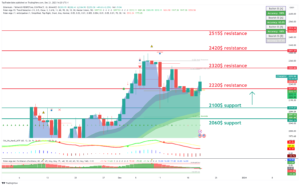
INTRO: ETH breaks through $2,220 as strong resistance and continues to push upwards.
Here is a technical analysis for the ETH/USDT chart:
Key Levels:
- Resistance: $2320, $2220
- Support: $2060, $2100
Strategy:
- Long: Buy at $2220 with a stop loss below $2060 and a target price of $2320.
- Short: Sell at $2220 with a stop loss above $2320 and a target price of $2100.
Range description:
ETH/USDT is currently trading in a range between $2100 and $2400. The pair broke into this range during the day. However, there are signs that the pair is ready to make a move with a possible retest of support.
On the upside, ETH/USDT is facing resistance at $2220. This level hasn’t been tested today, and if the price holds above it on the daily close, it will be confirmed as support. A break above $2220 would signal a bullish breakout and could send the pair higher to $2320.
On the downside, ETH/USDT is facing support at $2100. This level is a previous swing low and has been tested multiple times in recent weeks as resistance. A break below $2100 would signal a bearish breakdown and could send the pair lower to $2000 or even $1900.
ETH1D chart TW link: https://www.tradingview.com/x/dLFQGPKQ/
XRP:
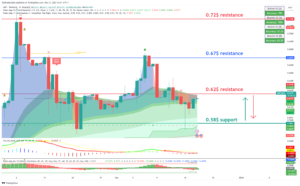
INTRO: XRP is trying to break through the $0.62 resistance to continue the bullish move.
Here is a technical analysis for the XRP/USDT chart:
Key Levels:
- Resistance: $0.62, $0.67
- Support: $0.58, $0.54
Strategy:
- Long: Buy at $0.62 with a stop loss below $0.58 and a target price of $0.67.
- Short: Sell at $0.62 with a stop loss above $0.67 and a target price of $0.58.
Range description:
XRP/USDT is currently trading in a range between $0.58 and $0.67. The pair shifted into this range during the day. However, there are signs that the pair is ready to make a move with a possible retest of support.
On the upside, XRP/USDT is facing resistance at $0.66. This level has been tested today, and if the price holds above it on the daily close, it will be confirmed as support. A break above $0.67 would signal a bullish breakout and could send the pair higher to $0.7.
On the downside, XRP/USDT is facing support at $0.62. This level is a previous swing low and has been tested multiple times in recent weeks as significant support. A break below $0.62 would signal a bearish breakdown and could send the pair lower to $0.58 or even $0.54.
XRP chart TW link: https://www.tradingview.com/x/WiTS7l1O/
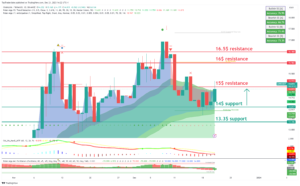
LINK:
INTRO: LINK is pushing hard against the $15 resistance.
Here is a technical analysis for the LINK/USDT chart:
Key Levels:
- Resistance: $16, $15
- Support: $13.3, $14
Strategy:
- Long: Buy at $14 with a stop loss below $13.3 and a target price of $16.
- Short: Sell at $15 with a stop loss above $16.5 and a target price of $14.
Range description:
LINK/USDT is currently trading in a range between $14 and $16. The pair shifted into this range during the day. However, there are signs that the pair is ready to make a move with a possible retest of support.
On the upside, LINK/USDT is facing resistance at $15. This level was tested today, and if the price holds above it on the daily close, it will be confirmed as support. A break above $15 would signal a bullish breakout and could send the pair higher to $17.
On the downside, LINK/USDT is facing support at $14. This level is a previous swing low and has been tested multiple times in recent weeks as significant resistance. A break below $14 would signal a bearish breakdown and could send the pair lower to $13 or even $14.
LINK chart TW link: https://www.tradingview.com/x/YUDW2U9h/
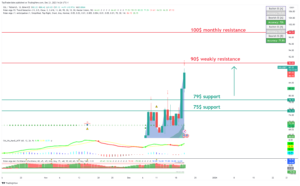
SOL:
INTRO: SOL is pushing hard and breaking through resistance in the form of a full bullish breakout.
Here is a technical analysis for the SOL/USDT chart:
Key Levels:
- Resistance: $90, $100
- Support: $75, $79
Strategy:
- Long: Buy at $79 with a stop loss below $75 and a target price of $90.
- Short: Sell at $90 with a stop loss above $100 and a target price of $79.
Range description:
SOL/USDT is currently trading in a range between $79 and $90. However, there are signs that the pair is ready to make a move to push strong resistance at $90.
On the upside, SOL/USDT is facing resistance at $90. This level was tested today, and if the price holds above it on the daily close, it will be confirmed as support. A break above $90 would signal a bullish breakout and could send the pair higher to $100.
On the downside, SOL/USDT is facing support at $79. This level is a previous swing low and has been tested multiple times in recent weeks as significant support. A break below $79 would signal a bearish breakdown and could send the pair lower to $75 or even $70.
SOL chart TW link: https://www.tradingview.com/x/Fd9mk2yL/
CRYPTO NEWS:
UK Builds Digital Securities Sandbox to Test New Technologies
The setup aims to facilitate controlled testing of blockchain and other emerging infrastructure technologies before wider deployment.
The UK Treasury has inaugurated a new “digital securities sandbox” (DSS) under the Financial Services and Markets Act, effective January 8, 2024. The sandbox provides a segregated financial laboratory where emerging technologies like blockchain can be thoroughly evaluated for use in broader financial market infrastructure.

The DSS regulations, presented before Parliament today, will enable eligible financial market entities to participate as ‘sandbox entrants’ conducting approved activities using developing technologies for a trial period of five years under modified regulatory requirements.
Example activities outlined in the act include ‘operating a trading venue’ and performing one or more functions related to digital securities, such as maintenance, notary services, and settlement. Entities approved for participation can also engage in ancillary activities directly related to those functions.
The instruments permissible in the sandbox encompass securities, options, futures, contracts for differences, and rights to or interests in such investments. These can be recorded or settled using the technologies under review.
“The implications of this for both investors and issuers are immense, notably the reduction of fees for all parties and the acceleration of clearing and settlement (and thus trading),” noted Ryan King, Head of Regulation and Privacy at the blockchain protocol Dusk. “This potentially opens up trading to a whole new generation of investors.”
“It is a sign that the EU is stepping up and preparing the ground for not simply tolerating but welcoming [distributed ledger technology] and associated technologies as a core part of the finance industry,” he continued.
Nearly 20 organizations provided comments to the Treasury on the proposal, according to Ledger Insights, which also reported that digital assets minted within the sandbox could be used outside of it as collateral, with holders not required to be sandbox participants.
FAST NEWS:
Uniswap, the largest on-chain marketplace for digital assets, is now available on Android and iOS. It provides the easiest way to enter the world of DeFi and seamlessly swap assets. Download the app today.*
7RCC has filed paperwork with the U.S. Securities and Exchange Commission (SEC) to apply for a spot Bitcoin ETF. According to the filings, the fund’s investment strategy is to hold ‘a combination of bitcoin and financial instruments to gain exposure to Carbon Credit Futures.’
Shiba Inu is planning to launch custom .shib domains. Internet domains ? memecoins.
The Google search volume for the term ‘Solana’ has increased by 250% from early October to early December. Pop quiz: what’s one of the most underrated metrics to track? Google searches.
A federal judge has approved the settlement between Binance and the Commodity Futures Trading Commission (CFTC). Under the terms of the settlement, Binance is required to pay a $1.35 billion penalty to the CFTC, and Changpeng Zhao, the former CEO of Binance, must pay $150 million.
OKX Wallet users are advised to update their iOS apps to address a vulnerability identified in a previous version of the app. Using the outdated version could potentially lead to the compromise of sensitive data and crypto assets.
A new Solana memecoin, Dogwifhat, has surged by 2,000 times over the last month. It’s another dog-themed coin, but this time, the dog comes with a hat. (Dogwifhat. Get it?)
Final words:
Market is trying to break resistance for another day and if fails we could se a bigger drop.
WE celebrate 1 year of blog posting by Top Trader Jake we are happy to announce that we upgrade BLOG post with more information and trading setups!
Please send us message what coin would you like to see in Trader Jake Technical Analysis we are ready to add more coins and setups.
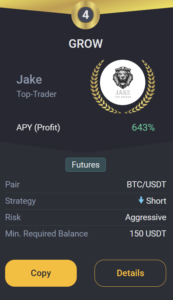
GROW BOT UPDATE:
Copy trade GROW 0.1->10k$ since 18.03 we got +176.0% PROFIT!
GROW CURENTLY:
TRADING COIN: BTC/USDT
SETUP: SHORT
TAKE PROFIT: 43.000 USDT
SAFETY ORDERS: 3/10
Liquidation: 57,000 USDT
Not Financial Advice!
Good luck with trades,
JAKE