

Big players sending their BTC in exchanges which could nuke the price soon.
Jake
TOP Trader
BTC:
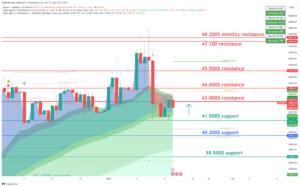
INTRO: BTC pushing 43k resistance.
Technical analysis for the BTC/USDT chart:
Key Levels:
- Resistance: $43,000, $44,000
- Support: $41,500, $40,200
Strategy:
- Long: Buy at $41,500 with a stop loss below $40,000 and a target price of $43,000.
- Short: Sell at $43,000 with a stop loss above $44,500 and a target price of $41,000.
Range description:
BTC/USDT is currently trading in a range between $41,500 and $48,000. The pair has broken into the range during the day. However, there are signs that the pair is ready to make a move with a possible retest of support.
On the upside, BTC/USDT is facing resistance at $43,000. The $43,000 level has been tested today, and if the price holds above on the daily close, it will be confirmed as support. A break above $43,000 would signal a bullish breakout and could send the pair higher to $45,500.
On the downside, BTC/USDT is facing support at $41,500. This level was a previous resistance for the day and now holds as support. A break below $41,500 would signal a bearish breakdown and could send the pair lower to $40,000 or even $38,000.
BTC1D chart TW link: https://www.tradingview.com/x/RIQGjI2Z/
ETH:
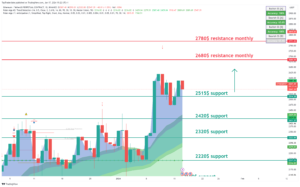
INTRO: ETH pushing above 2500$ and need to hold for bullish continuation.
Here is a technical analysis for the ETH/USDT chart:
Key Levels:
- Resistance: $2780, $2680
- Support: $2420, $2515
Strategy:
- Long: Buy at $2515 with a stop loss below $2400 and a target price of $2720.
- Short: Sell at $2680 with a stop loss above $2720 and a target price of $2400.
Range description:
ETH/USDT is currently trading in a range between $2400 and $2700. The pair has broken into the range during the day. However, there are signs that the pair is ready to make a move with a possible retest of support.
On the upside, ETH/USDT is facing resistance at $2680. This level hasn’t been tested today, and if the price holds above on the daily close, it will be confirmed as support. A break above $2680 would signal a bullish breakout and could send the pair higher to $2720.
On the downside, ETH/USDT is facing support at $2420. This level is a previous swing low and has been tested multiple times in recent weeks as resistance. A break below $2420 would signal a bearish breakdown and could send the pair lower to $2220 or even $2000.
ETH1D chart TW link: https://www.tradingview.com/x/4YQm9tTS/
XRP:
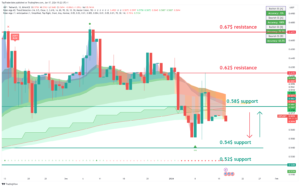
INTRO: XRP holding above 0.58$ and need hold up to catch up with BTC.
Here is a technical analysis for the XRP/USDT chart:
Key Levels:
- Resistance: $0.62, $0.67
- Support: $0.54, $0.58
Strategy:
- Long: Buy at $0.58 with a stop loss below $0.52 and a target price of $0.62.
- Short: Sell at $0.62 with a stop loss above $0.67 and a target price of $0.58.
Range description:
XRP/USDT is currently trading in a range between $0.54 and $0.62. The pair has shifted into the range during the day. However, there are signs that the pair is ready to make a move with a possible retest of support.
On the upside, XRP/USDT is facing resistance at $0.62. This level has been tested today, and if the price holds above on the daily close, it will be confirmed as support. A break above $0.62 would signal a bullish breakout and could send the pair higher to $0.67.
On the downside, XRP/USDT is facing support at $0.58. This level is a previous swing low and has been tested multiple times in recent weeks as significant support. A break below $0.58 would signal a bearish breakdown and could send the pair lower to $0.54 or even $0.48.
XRP chart TW link: https://www.tradingview.com/x/8pCR7lb2/
LINK:
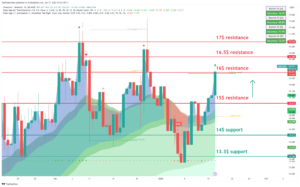
INTRO: LINK pushing high above 15$ resistance.
Here is a technical analysis for the LINK/USDT chart:
Key Levels:
- Resistance: $15, $16
- Support: $13.3, $14
Strategy:
- Long: Buy at $14 with a stop loss below $13 and a target price of $16.
- Short: Sell at $15 with a stop loss above $16 and a target price of $14.
Range description:
LINK/USDT is currently trading in a range between $14 and $17. The pair has shifted into the range during the day. However, there are signs that the pair is ready to make a move with a possible retest of support.
On the upside, LINK/USDT is facing resistance at $15. This level has been tested today, and if the price holds above on the daily close, it will be confirmed as support. A break above $15 would signal a bullish breakout and could send the pair higher to $16.
On the downside, LINK/USDT is facing support at $14. This level is a previous swing low and has been tested multiple times in recent weeks as significant resistance. A break below $14 would signal a bearish breakdown and could send the pair lower to $13 or even $13.
LINK chart TW link: https://www.tradingview.com/x/gNAIH0sx/
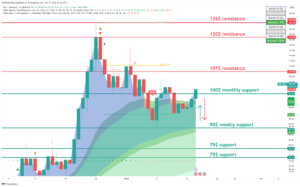
SOL:
INTRO: SOL fighting with 100$ resistance.
Here is a technical analysis for the SOL/USDT chart:
Key Levels:
- Resistance: $107, $120
- Support: $90, 100$
Strategy:
- Long: Buy at $100 with a stop loss below $90 and a target price of $120.
- Short: Sell at $107 with a stop loss above $120 and a target price of $100.
Range description:
SOL/USDT is currently trading in a range between $100 and $126. However, there are signs that the pair is ready to make a move to push strong resistance at $120.
On the upside, SOL/USDT is facing resistance at $107. This level has been tested today, and if the price holds above on the daily close, it will be confirmed as support. A break above $107 would signal a bullish breakout and could send the pair higher to $126.
On the downside, SOL/USDT is facing support at $100. This level is a previous swing low and has been tested multiple times in recent weeks as significant support. A break below $100 would signal a bearish breakdown and could send the pair lower to $90 or even $80.
SOL chart TW link: https: https://www.tradingview.com/x/c8iJuNJu/
CRYPTO NEWS:
THINGS SMART PEOPLE ARE TALKING ABOUT
1/ Digital asset investment products hit $17.5B in trading volume last week.
That’s the highest weekly volume on record. Period.
In total, digital asset investment products saw $1.18B of inflows.
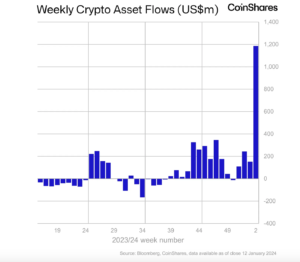
Here’s everything you need to know about the latest report:
- Digital asset investment products saw $1.18 billion in total inflows, which is three times more than any weekly flows from last year.
- Trading volumes hit $17.5 billion, setting a new record. For reference, the average weekly trading volume last year was approximately $2 billion.
- These volumes represented about 90% of daily trading volumes on trusted exchanges last Friday, compared to the typical range of 2%-10%.
- It was a tale of two regions: the U.S. saw $1.24 billion in total inflows, while Europe had minor outflows.
- BTC led the way with $1.14 billion, and ETH came in second place with $26 million in inflows.
- Most altcoins saw minor inflows, with XRP, SOL, DOT, and ADA all experiencing inflows ranging between $0.2 million and $5.6 million.
- Blockchain equities had another significant week with $98 million in total inflows. This brings the total inflows over the last 7 weeks to… checks notes… $608 million.
That’s right. Crypto doesn’t just break hearts; it breaks records sometimes too.
We’ll see if the momentum continues this week.
2/ The stablecoin market cap is slowly recovering.
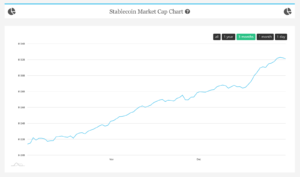
Over the last 3 months, the stablecoin market cap has been steadily increasing.
- It’s up $11 billion since mid-October.
- It’s up $4 billion in January alone.
Why this matters: Stablecoins are the casino chips of crypto. More stablecoins = more money people have to spend in the crypto casino.
This is a good sign that investors are getting their chips ready to make more big moves soon.
3/ The on-chain prediction market is on fire
Polymarket is a decentralized prediction market built on Polygon. It lets you bet on stuff like…
- Will the Detroit Pistons end the season as the worst NBA team of all time? (For reference, they’re 4-36 and couldn’t beat your local YMCA team if they tried).
- Will Taylor Swift and Travis Kelce break up by March 1?
- Will another plane’s cabin door blow off in January?
And Polymarket’s daily volume has exploded recently.
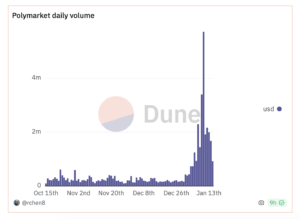
Polymarket has already achieved $26M+ in monthly volume, the highest since 2021, and we’re only halfway through January.
Why this matters: Many investors believe that 2024 will be a breakout year for the on-chain predictions market.
- Bitwise predicts that over $100M will be staked in the prediction market as it emerges as crypto’s new “killer app.”
- Nick Tomaino from 1confirmation thinks Polymarket will surpass $1B in volume and acquire 1 million users this year. We could see it happening too. If there’s one thing we’ve learned, it’s that birds fly, fish swim, and degens degen.
And on-chain betting + predictions seem like a match made in degenerate heaven.
FAST NEWS:
MakerDAO’s $2.4 billion in crypto loans has just become the protocol’s biggest moneymaker. Crypto-backed lending currently accounts for $122 million of MakerDAO’s $243 million, approximately 50%, in total projected annual revenue. —DL News
Larry Fink (BlackRock’s CEO) says he sees value in having an Ethereum ETF. “These are just stepping stones towards tokenization, and I really do believe this is where we’re going to be going.” – Larry “MoneyMan” Fink.
GameStop is winding down its NFT marketplace. According to a company statement, it’s because of “the continuing regulatory uncertainty of the crypto space.” (R.I.P.)
Mercedes-Benz unveiled its new “in-car NFT gallery” at the Consumer Electronics Show (CES). The car also comes with an A.I. virtual assistant that interacts with drivers using one of four “emotional profiles” – natural, predictive, personal, and empathetic modes.
Google Cloud is now a validator and infrastructure provider for the Flare blockchain. Flare’s token, $FLR, is up 8% after the news.
Final words:
BTC could drop but Altcoins are holding good and there is big possibility of local push up.
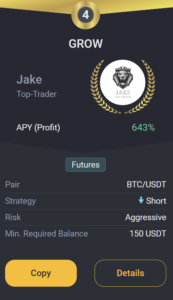
GROW BOT UPDATE:
Copy trade GROW 0.1->10k$ since 18.03 we got +214.0% PROFIT!
GROW CURENTLY:
TRADING COIN: BTC/USDT
SETUP: SHORT
TAKE PROFIT: /
SAFETY ORDERS: /
Liquidation: /
Not Financial Advice!
Good luck with trades,
JAKE