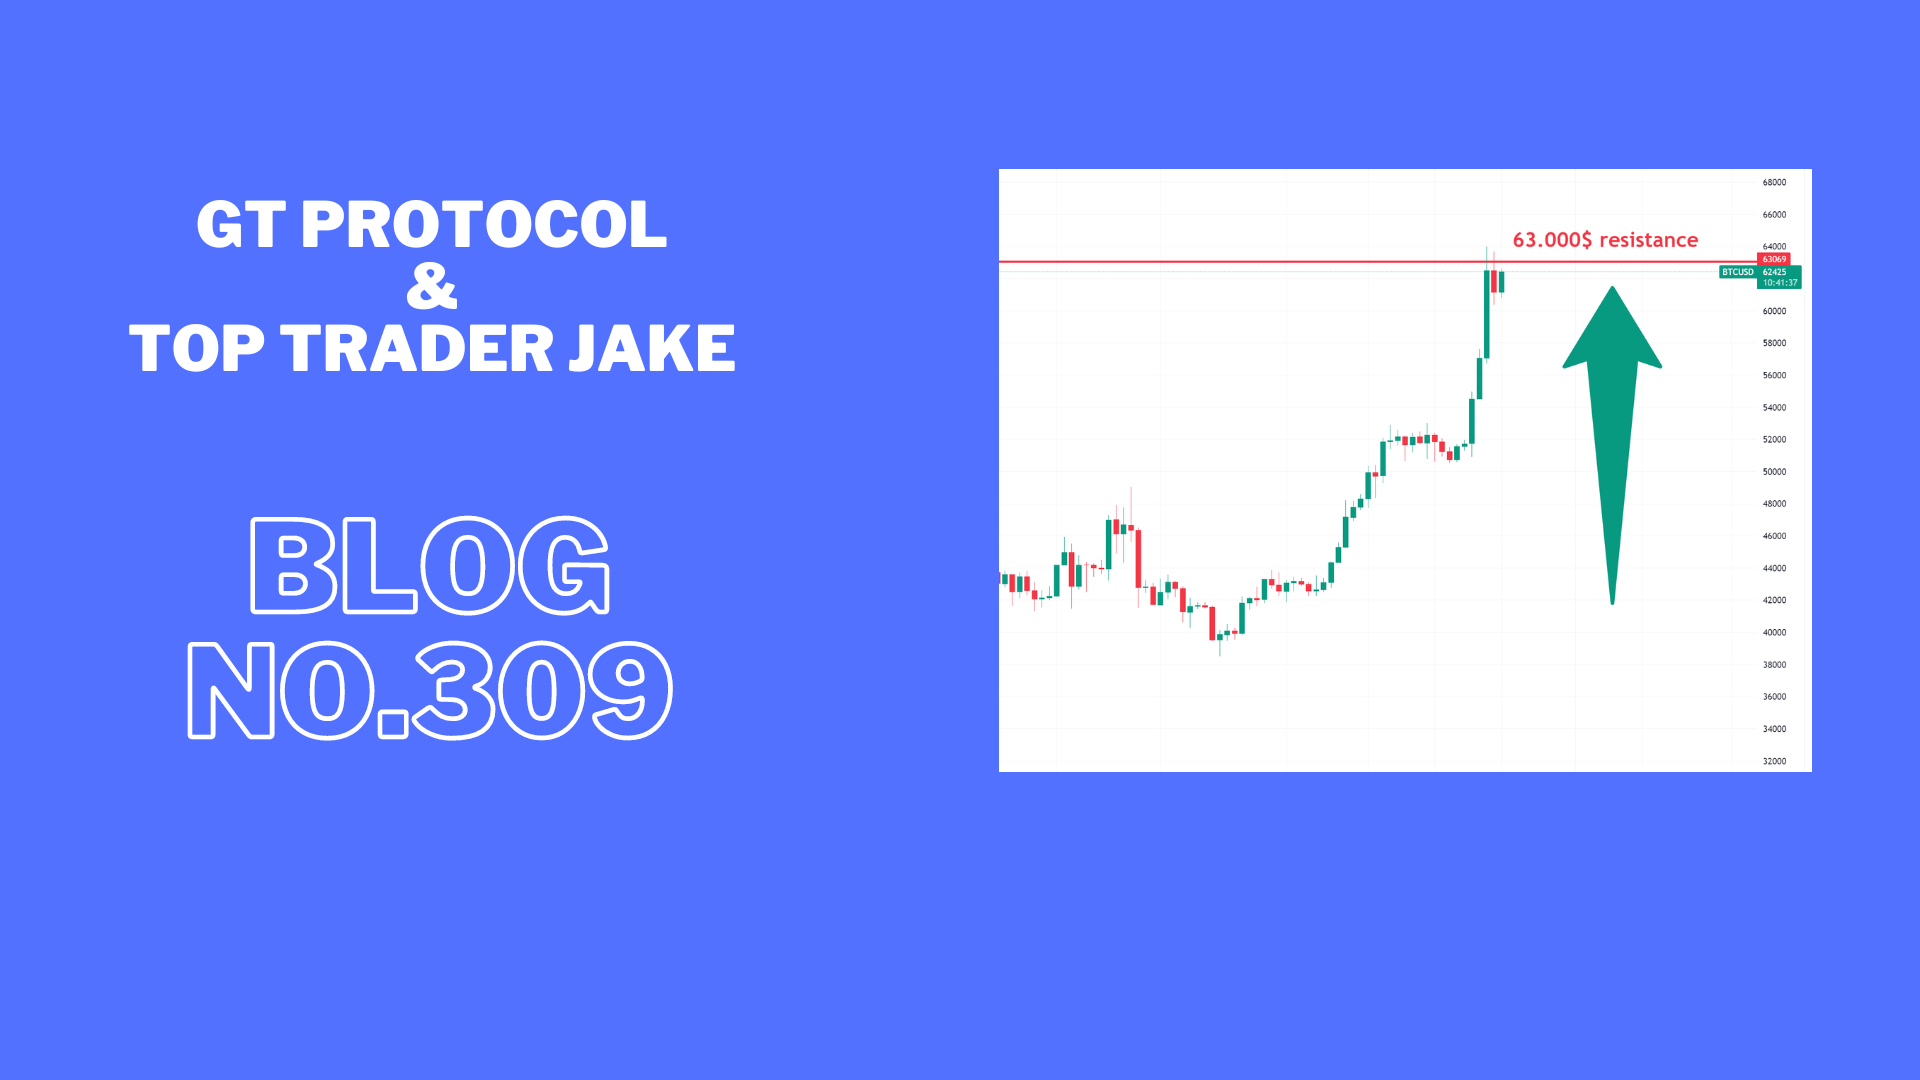


BTC consolidating under resistance 63k and needs a strong buy move for a bigger push-up.
Jake
TOP Trader
BTC:
INTRO: BTC pushing into 63k resistance.
Technical analysis for the BTC/USDT chart:
Key Levels:
- Resistance: $63,000
- Support: $50,000, $48,200
Strategy:
- Long: Buy at $60,100 with a stop loss below $59,000 and a target price of $63,000.
- Short: Sell at $63,000 with a stop loss above $63,500 and a target price of $60,000.
Range Description:
BTC/USDT is currently trading between $60,000 and $63,000. The pair has broken into the range during the day. However, there are signs that the pair is ready to make a move with a possible retest of support.
On the upside, BTC/USDT is facing resistance at $63,000. The $60,000 level has been tested today, and if the price holds above it on a daily close, it will be confirmed as support. A break above $63,000 would signal a bullish breakout and could send the pair higher to $65,000.
On the downside, BTC/USDT is facing support at $58,500. This level was a previous resistance for the day and now holds as support. A break below $58,500 would signal a bearish breakdown, sending the pair lower to $55,000 or even $52,000.
BTC1D chart TW link: https://www.tradingview.com/x/HIX21bCl/
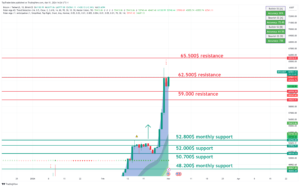
ETH:
INTRO: ETH pushing to 3400$.
Here is a technical analysis of the ETH/USDT chart:
Key Levels:
- Resistance: $3400, $3300
- Support: $3000, $3100
Strategy:
- Long: Buy at $3200 with a stop loss below $3000 and a target price of $3400.
- Short: Sell at $3400 with a stop loss above $3500 and a target price of $3000.
Range Description:
ETH/USDT is currently trading between $3,000 and $3,400. The pair has broken into the range during the day. However, there are signs that the pair is ready to make a move with a possible retest of support.
On the upside, ETH/USDT is facing resistance at $3,400. This level hasn’t been tested today, and if the price holds above it on a daily close, it will be confirmed as support. A break above $3,400 would signal a bullish breakout and could send the pair higher to $3,500.
On the downside, ETH/USDT is facing support at $3,200. This level is a previous swing low and has been tested multiple times in recent weeks as resistance. A break below $3,200 would signal a bearish breakdown, sending the pair lower to $3,000 or even $2,900.
ETH1D chart TW link: https://www.tradingview.com/x/klA96JnD/
XRP:
INTRO: XRP pushing into 0.58$.
Here is a technical analysis of the XRP/USDT chart:
Key Levels:
- Resistance: $0.50, $0.52
- Support: $0.48, $0.46
Strategy:
- Long: Buy at $0.48 with a stop loss below $0.46 and a target price of $0.58.
- Short: Sell at $0.50 with a stop loss above $0.52 and a target price of $0.46.
Range Description:
XRP/USDT is currently trading between $0.48 and $0.52. The pair has shifted into the range during the day. However, there are signs that the pair is ready to make a move with a possible retest of support.
On the upside, XRP/USDT is facing resistance at $0.50. This level has been tested today, and if the price holds above it on a daily close, it will be confirmed as support. A break above $0.50 would signal a bullish breakout and could send the pair higher to $0.52.
On the downside, XRP/USDT is facing support at $0.48. This level is a previous swing low and has been tested multiple times in recent weeks as significant support. A break below $0.48 would signal a bearish breakdown and could send the pair lower to $0.46 or even $0.44.
XRP chart TW link: https://www.tradingview.com/x/aDHzoDpC/
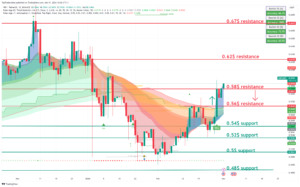
LINK:
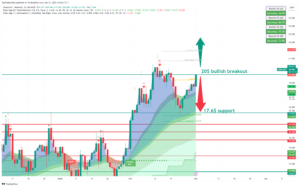
INTRO: LINK pushing into 20$.
Here is a technical analysis for the LINK/USDT chart:
Key Levels:
- Resistance: $20
- Support: $17.6
Strategy:
- Long: Buy at $17.6 with a stop loss below $17 and a target price of $20.
- Short: Sell at $20 with a stop loss above $21 and a target price of $17.6.
Range Description:
LINK/USDT is currently trading between $17 and $20. The pair has shifted into the range during the day. However, there are signs that the pair is ready to make a move with a possible retest of support.
On the upside, LINK/USDT is facing resistance at $20. This level has been tested today, and if the price holds above it on a daily close, it will be confirmed as support. A break above $20 would signal a bullish breakout and could send the pair higher to $22.
On the downside, LINK/USDT is facing support at $17.60. This level is a previous swing low and has been tested multiple times in recent weeks as significant resistance. A break below $17.60 would signal a bearish breakdown and could send the pair lower to $17 or even $16.
LINK chart TW link: https://www.tradingview.com/x/HFBZph2g/
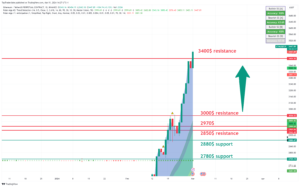
SOL:
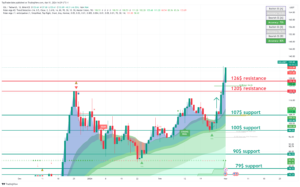
INTRO: SOL retesting 120$ support.
Here is a technical analysis of the SOL/USDT chart:
Key Levels:
- Resistance: $100, $107
- Support: $79, 90$
Strategy:
- Long: Buy at $90 with a stop loss below $75 and a target price of $100.
- Short: Sell at $100 with a stop loss above $ 107 and a target price of $90.
Range Description:
SOL/USDT is currently trading between $75 and $100. However, there are signs that the pair is ready to make a move to push through strong resistance at $90.
On the upside, SOL/USDT is facing resistance at $100. This level has been tested today, and if the price holds above it on a daily close, it will be confirmed as support. A break above $100 would signal a bullish breakout and could send the pair higher to $107.
On the downside, SOL/USDT is facing support at $90. This level is a previous swing low and has been tested multiple times in recent weeks as significant support. A break below $90 would signal a bearish breakdown and could send the pair lower to $70 or even $60.
SOL chart TW link: https://www.tradingview.com/x/YXyTjb57/
CRYPTO NEWS:
THE RULE OF 10 BEST DAYS
Check it out. I just learned about something called the “Rule of 10 Best Days”.
Here’s what it says:
- The majority of BTC’s yearly gains happen across 10 days.
- If you miss those days, you miss out on most of BTC’s returns.
This has been a trend since 2013. And, so far, it’s happening again this year…
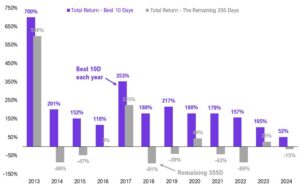
The tricky part is…you don’t know when those 10 days will be.
The lesson: Stop trying to “time the market”.
Timing 10 out of 365 days a year, perfectly, is damn near impossible.
Most people are better off buying, holding, and accumulating over time.
FAST NEWS:
Gemini will return $1.1B to customers affected by its failed ‘Gemini Earn’ program. If the settlement is approved, then “Earn users can expect to receive approximately 97% of their assets in kind within about two months.”
Bitcoin ETFs saw $7.6B in trading volume – a new daily record. Plus, Bitcoin ETFs saw a net inflow of $673M… another daily record. BTC is eating up records for breakfast, lunch, and dinner (and the occasional midnight snack).
The U.S. government moved $952M in seized BTC. Fun Fact: The U.S. government holds $8B+ in BTC. (Uncle Sam is loaded).
Marathon Digital is launching a new platform called Anduro to help users develop Bitcoin sidechains. The Bitcoin miner has already started building its own sidechain, Alys, which focuses on issuing and trading tokenized real-world assets (RWAs).
Morgan Stanley is thinking about adding spot Bitcoin ETF products to its brokerage platform. Well, well, well… how the tables have turned. From “We wouldn’t touch BTC with a 10-foot pole!” —> “Hmm… maybe just a kiss!”
Final words:
We could se a retest of support in coming days and after that bigger push up.
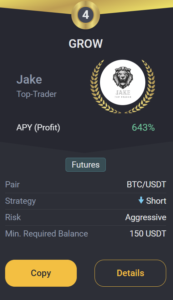
GROW BOT UPDATE:
Copy trade GROW 0.1->10k$ since 18.03.23 we got +219.0% PROFIT!
GROW CURENTLY:
TRADING COIN: BTC/USDT
SETUP: SHORT
TAKE PROFIT: /
SAFETY ORDERS: /
Liquidation: /
Not Financial Advice!
Good luck with trades,
JAKE