

Dear traders,
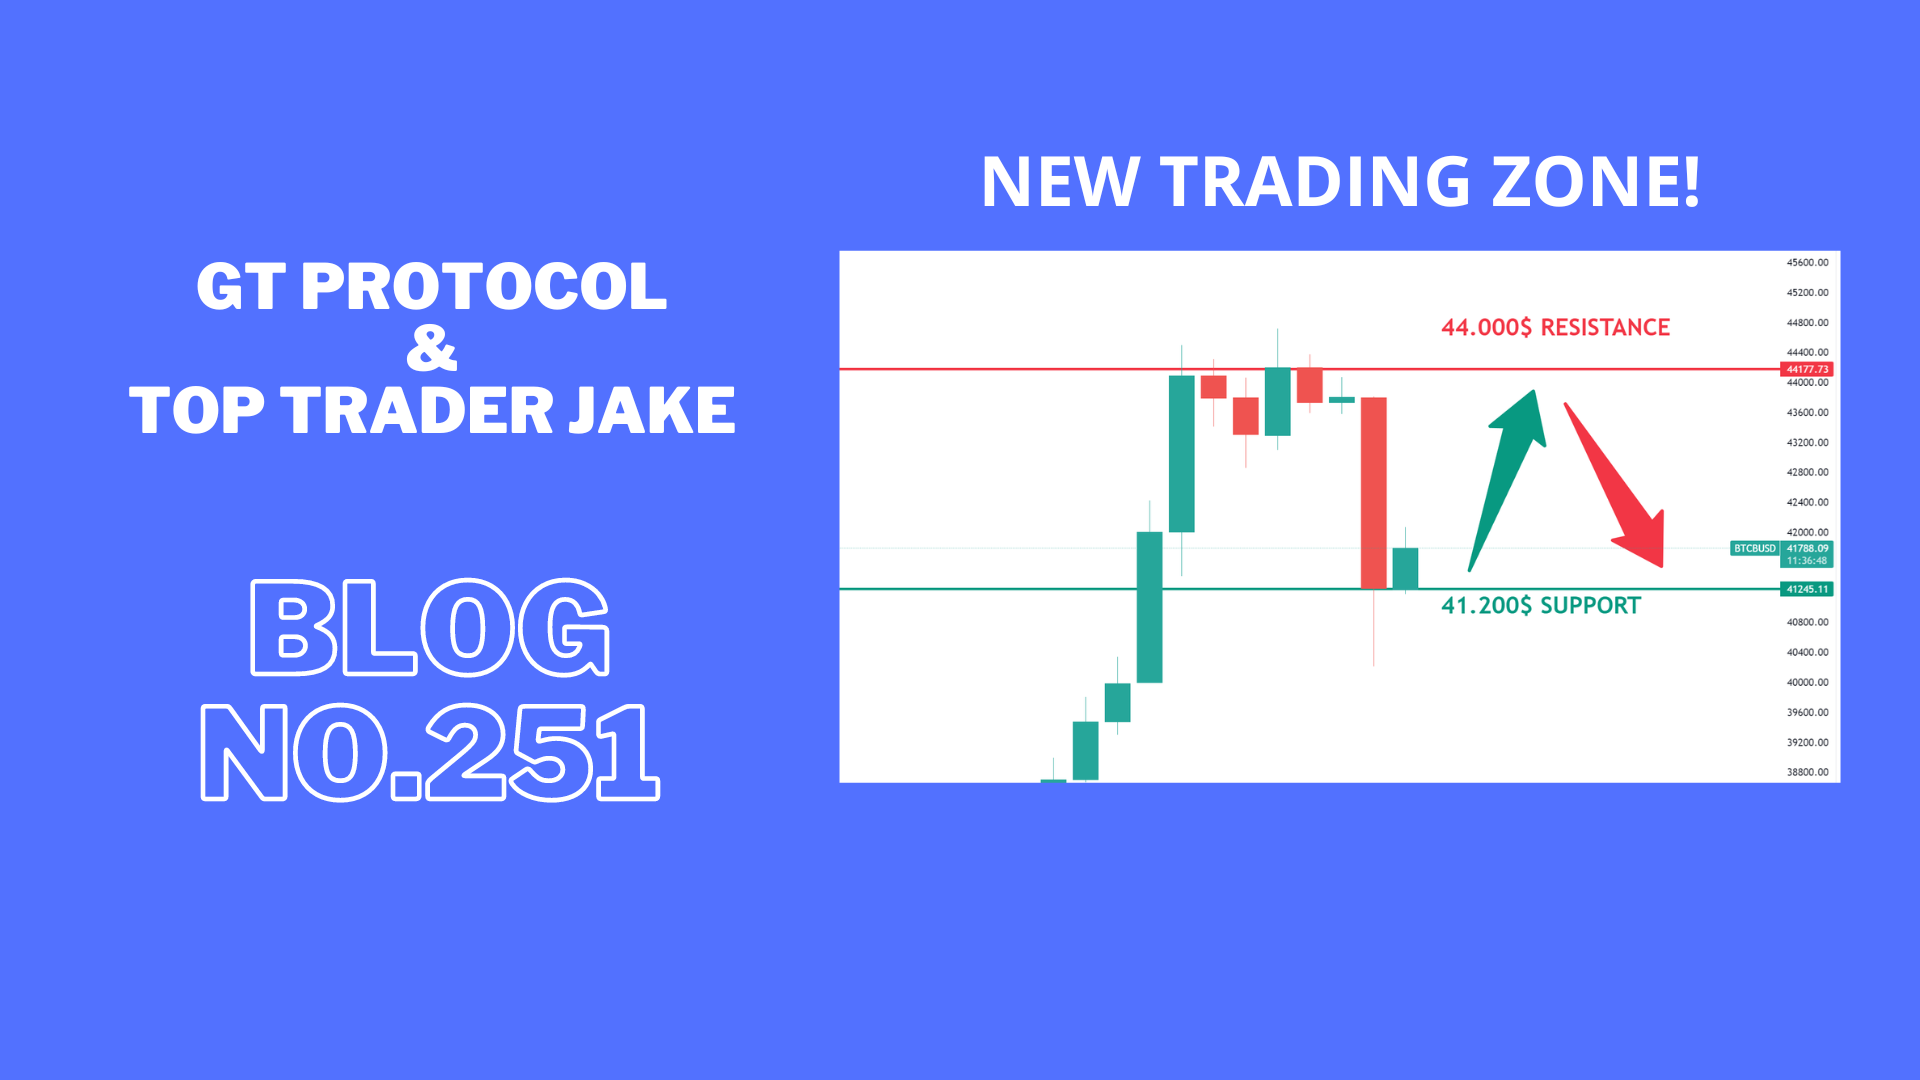
BTC find support and now opening new trading zone. Still in danger of bigger push down if support don’t hold.
Jake
TOP Trader
BTC:
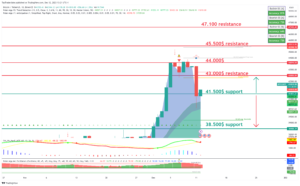
INTRO:BTC made a significant retest of support at 41.5k and needs to hold above for a bigger push up.
Technical analysis for the BTC/USDT chart:
Key Levels:
- Resistance: $43,000, $41,500
- Support: $38,500, $41,500
Strategy:
- Long: Buy at $41.500 with a stop loss below $40,000 and a target price of $44,000.
- Short: Sell at $44,000 with a stop loss above $45,500 and a target price of $40,000.
Range description:
BTC/USDT is currently trading in a range between $41,500 and $44,000. The pair has broken into the range during the day. However, there are signs that the pair is ready to make a move with a possible retest of support.
On the upside, BTC/USDT is facing resistance at $44,000. The $43,000 level has been tested today, and if the price holds above it on the daily close, it will be confirmed as support. A break above $44,000 would signal a bullish breakout and could send the pair higher to $45,500.
On the downside, BTC/USDT is facing support at $43,000. This level was a previous resistance for the day and now holds as support. A break below $40,000 would signal a bearish breakdown and could send the pair lower to $37,000 or even $35,000.
BTC1D chart TW link: https://www.tradingview.com/x/6hGyG8Xb/
ETH:
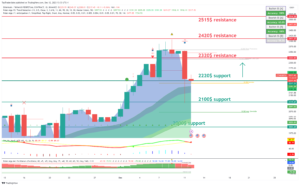
INTRO: ETH breaks below support at $2300 and needs to push back for bullish continuation. Still, a bigger sell-off is possible, leading to a retest of the $2100 support.
Here is a technical analysis for the ETH/USDT chart:
Key Levels:
- Resistance: $2320, $2420
- Support: $2220, $2100
Strategy:
- Long: Buy at $2300 with a stop loss below $2100 and a target price of $2515.
- Short: Sell at $2320 with a stop loss above $2520 and a target price of $2100.
Range description:
ETH/USDT is currently trading in a range between $2100 and $2400. The pair has broken into range during the day. However, there are signs that the pair is ready to make a move with a possible retest of support.
On the upside, ETH/USDT is facing resistance at $2320. This level hasn’t been tested today, and if the price holds above on the daily close, it will be confirmed as support. A break above $2320 would signal a bullish breakout and could send the pair higher to $2420.
On the downside, ETH/USDT is facing support at $2220. This level is a previous swing low and has been tested multiple times in recent weeks as resistance. A break below $2220 would signal a bearish breakdown and could send the pair lower to $2000 or even $1900.
ETH1D chart TW link: https://www.tradingview.com/x/Dwvf98Us/
XRP:
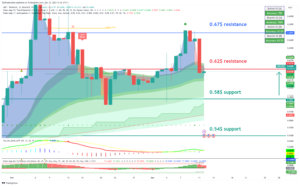
INTRO: XRP still fights with 0.62$ resistance and need to break it for full bullish confirmation. Still lack of buy volume for push up. Strong push up to 0.67$ is what will break big resistance and push strong up.
Here is a technical analysis for the XRP/USDT chart:
Key Levels:
- Resistance: $0.62, $0.67
- Support: $0.58, $0.54
Strategy:
- Long: Buy at $0.62 with a stop loss below $0.58 and a target price of $0.67.
- Short: Sell at $0.62 with a stop loss above $0.67 and a target price of $0.58.
Range description:
XRP/USDT is currently trading in a range between $0.58 and $0.67. The pair has shifted into the range during the day. However, there are signs that the pair is ready to make a move with a possible retest of support.
On the upside, XRP/USDT is facing resistance at $0.66. This level has been tested today, and if the price holds above on the daily close, it will be confirmed as support. A break above $0.67 would signal a bullish breakout and could send the pair higher to $0.7.
On the downside, XRP/USDT is facing support at $0.62. This level is a previous swing low and has been tested multiple times in recent weeks as significant support. A break below $0.62 would signal a bearish breakdown and could send the pair lower to $0.58 or even $0.54.
XRP chart TW link: https://www.tradingview.com/x/WsdAlxOD/
LINK:
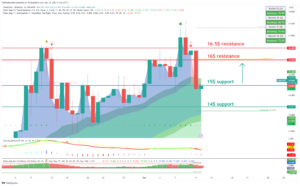
INTRO: LINK is retesting the $14 support and needs to hold above $15 for bullish continuation.
Here is a technical analysis for the XRP/USDT chart:
Key Levels:
- Resistance: $16, $16.5
- Support: $15, $14
Strategy:
- Long: Buy at $15 with a stop loss below $14 and a target price of $16.
- Short: Sell at $16 with a stop loss above $16.5 and a target price of $15.
Range description:
LINK/USDT is currently trading in a range between $15 and $16. The pair has shifted into the range during the day. However, there are signs that the pair is ready to make a move, with a possible retest of support.
On the upside, LINK/USDT is facing resistance at $16. This level has been tested today, and if the price holds above on the daily close, it will be confirmed as support. A break above $16 would signal a bullish breakout and could send the pair higher to $17.
On the downside, LINK/USDT is facing support at $15. This level is a previous swing low and has been tested multiple times in recent weeks as significant resistance. A break below $15 would signal a bearish breakdown and could send the pair lower to $14 or even $13.
LINK chart TW link: https://www.tradingview.com/x/GCdwtReR/
SOL:
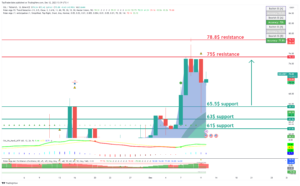
INTRO: SOL faces a strong rejection from the $75 resistance and is retesting the $65 support.
Here is a technical analysis for the SOL/USDT chart:
Key Levels:
- Resistance: $75, $78.8
- Support: $65.5, $63
Strategy:
- Long: Buy at $65.5 with a stop loss below $61 and a target price of $75.
- Short: Sell at $75 with a stop loss above $78.8 and a target price of $65.5.
Range description:
SOL/USDT is currently trading in a range between $65 and $75.5. However, there are signs that the pair is ready to make a move to push strong resistance at $75.
On the upside, SOL/USDT is facing resistance at $75. This level has been tested today, and if the price holds above on the daily close, it will be confirmed as support. A break above $75 would signal a bullish breakout and could send the pair higher to $78.8.
On the downside, SOL/USDT is facing support at $65.5. This level is a previous swing low and has been tested multiple times in recent weeks as significant support. A break below $65.5 would signal a bearish breakdown and could send the pair lower to $62 or even $58.
SOL chart TW link: https: https://www.tradingview.com/x/TyGx24Mj/
CRYPTO NEWS:
2 THINGS TO KEEP YOUR EYES ON THIS WEEK
We’ve got a BIG week ahead. And there are 2 things everyone should keep their eyes on…
1/ U.S. macro data
- The U.S. Consumer Price Index (CPI) and Producer Price Index (PPI) data are being released on Tuesday. This will give us a better idea as to whether the Fed will raise/lower interest rates next month.
- The U.S. Federal Reserve will decide whether to raise, lower, or keep interest rates the same on Wednesday. According to the CME FedWatch Tool, there’s a 98% chance interest rates will remain unchanged.
2/ Token unlocks
In total, over $225M in crypto tokens are being unlocked this week.
- APT is unlocking $192M worth of tokens.
- APE is unlocking $25.5M worth of tokens.
- CYBER is unlocking $7.7M worth of tokens.
Buckle up ladies & gents, if token unlocks had a middle name it’d be “Volatility”.
Proceed with caution.

FAST NEWS:
El Salvador is launching a new visa program offering citizenship to crypto investors. Applicants pay a $999 deposit in Bitcoin or Tether, undergo KYC, and, if approved, the deposit counts towards a $1M Bitcoin or Tether investment in return for citizenship.—DL News
YieldMax is planning to launch a new ETF focused on MicroStrategy’s stock price. The proposed fund would use a “synthetic covered call strategy” to offer indirect exposure to MicroStrategy’s share price.
Starknet Foundation teases a new token airdrop in 2024. The Ethereum layer-2 outlined a plan to distribute over 1.8 billion STRK tokens through various initiatives aimed at driving adoption and growth on the blockchain.
Reebok is teaming up with Futureverse to develop blockchain-based games and digital experiences. The goal? “Revolutionize fashion in the digital world.
Fidelity held a meeting with the U.S. Securities and Exchange Commission late last week to talk about its spot Bitcoin ETF application. According to the memo, Fidelity provided a presentation called “Bitcoin ETF Workflows” that included slides that detailed “In-Kind” creation and redemption models.
A U.S. judge ruled that Changpeng Zhao must remain in the U.S. until his sentencing date in February. The former CEO of Binance is facing charges for violating money laundering laws.
Final words:
Drop retest happened and now support need to hold or bigger drop is still possible.
WE celebrate 1 year of blog posting by Top Trader Jake we are happy to announce that we upgrade BLOG post with more information and trading setups!
Please send us message what coin would you like to see in Trader Jake Technical Analysis we are ready to add more coins and setups.
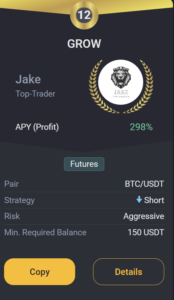
GROW BOT UPDATE:
Copy trade GROW 0.1->10k$ since 18.03 we got +162.0% PROFIT!
GROW CURENTLY:
TRADING COIN: BTC/USDT
SETUP: SHORT
TAKE PROFIT: 41,176 USDT
SAFETY ORDERS: 1/10
Liquidation: 87,000 USDT
Not Financial Advice!
Good luck with trades,
JAKE