

Dear traders,
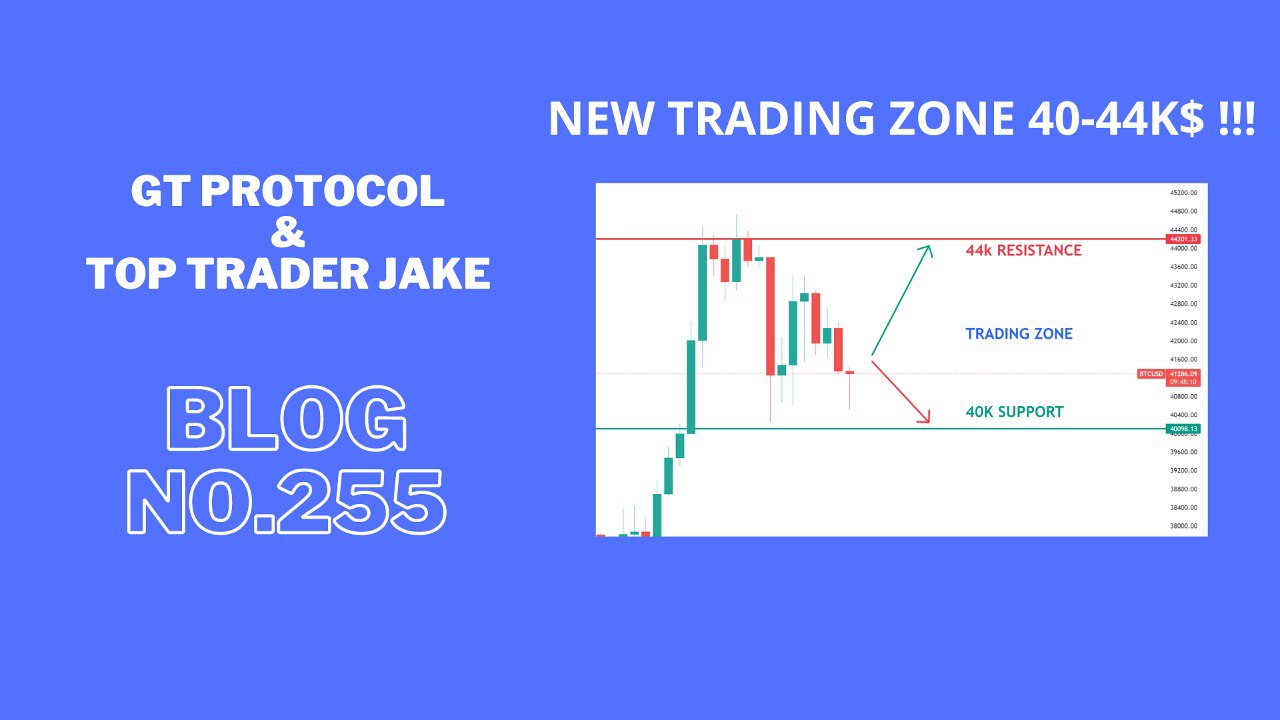
BTC is finding support at 40k and making a new trading range that needs to be held before the end of the year.
Jake
TOP Trader
BTC:
INTRO: BTC retest support at 40k and now needs to push back over 43k for bullish continuation.
Technical analysis for the BTC/USDT chart:
Key Levels:
• Resistance: $43,000, $41,500
• Support: $38,500, $41,500
Strategy:
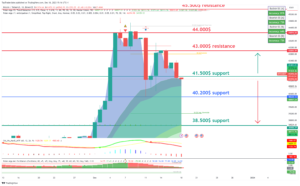
• Long: Buy at $41.500 with a stop loss below $40,000 and a target price of $44,000.
• Short: Sell at $43,000 with a stop loss above $44,500 and a target price of $40,000.
Range Description:
BTC/USDT is currently trading in a range between $40,500 and $44,000. The pair has broken into range during the day. However, there are signs that the pair is ready to make a move with possible retest of support.
On the upside, BTC/USDT is facing resistance at $44,000. And 43,000$ level has been tested today and if the price holds above on the daily close it will be confirmed as support. A break above $43,000 would signal a bullish breakout and could send the pair higher to $45,500.
On the downside, BTC/USDT is facing support at $41,500. This level is a previous resistance for the day and now holds as support. A break below $40,000 would signal a bearish breakdown and could send the pair lower to $37,000 or even $35,000.
BTC1D chart TW link: https://www.tradingview.com/x/co4FWQTU/
ETH:
INTRO: ETH retests 2100$ support and needs to hold above for bullish continuation.
Here is a technical analysis of the ETH/USDT chart:
Key Levels:
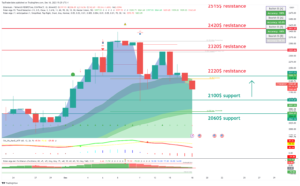
• Resistance: $2320, $2220
• Support: $2060, $2100
Strategy:
• Long: Buy at $2100 with a stop loss below $2060 and a target price of $2320.
• Short: Sell at $2220 with a stop loss above $2320 and a target price of $2100.
Range Description:
ETH/USDT is currently trading in a range between $2100 and $2400. The pair has broken into range during the day. However, there are signs that the pair is ready to make a move with possible retest of support.
On the upside, ETH/USDT is facing resistance at $2220. This level wasn’t tested today and if the price holds above on the daily close it will be confirmed as support. A break above $2220 would signal a bullish breakout and could send the pair higher to $2320.
On the downside, ETH/USDT is facing support at $2100. This level is a previous swing low and has been tested multiple times in recent weeks as resistance. A break below $2100 would signal a bearish breakdown and could send the pair lower to $2000 or even $1900.
ETH1D chart TW link: https://www.tradingview.com/x/v4GKNZPD/
XRP:
INTRO: XRP retests 0.58$ support and needs to hold above for bullish continuation.
Here is a technical analysis of the XRP/USDT chart:
Key Levels:
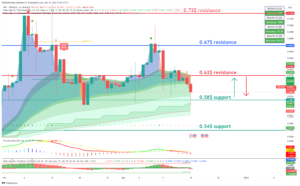
• Resistance: $0.62, $0.67
• Support: $0.58, $0.54
Strategy:
• Long: Buy at $0.62 with a stop loss below $0.58 and a target price of $0.67.
• Short: Sell at $0.62 with a stop loss above $0.67 and a target price of $0.58.
Range Description:
XRP/USDT is currently trading in a range between $0.58 and $0.67. The pair has shifted into range during the day. However, there are signs that the pair is ready to make a move with possible retest of support.
On the upside, XRP/USDT is facing resistance at $0.66. This level has been tested today and if the price holds above on the daily close it will be confirmed as support. A break above $0.67 would signal a bullish breakout and could send the pair higher to $0.7.
On the downside, XRP/USDT is facing support at $0.62. This level is a previous swing low and has been tested multiple times in recent weeks as big support. A break below $0.62 would signal a bearish breakdown and could send the pair lower to $0.58 or even $0.54.
XRP chart TW link: https://www.tradingview.com/x/8UAnHELz/
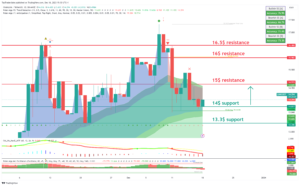
LINK:
INTRO: LINK retest 14$ support and need to hold above 15$ for bullish continuation.
Here is a technical analysis for the LINK/USDT chart:
Key Levels:
• Resistance: $16, $15
• Support: $13.3, $14
Strategy:
• Long: Buy at $14 with a stop loss below $13.3 and a target price of $16.
• Short: Sell at $15 with a stop loss above $16.5 and a target price of $14.
Range Description:
LINK/USDT is currently trading in a range between $14 and $16. The pair has shifted into range during the day. However, there are signs that the pair is ready to make a move with possible retest of support.
On the upside, LINK/USDT is facing resistance at $15. This level has been tested today and if the price holds above on the daily close it will be confirmed as support. A break above $15 would signal a bullish breakout and could send the pair higher to $17.
On the downside, LINK/USDT is facing support at $14. This level is a previous swing low and has been tested multiple times in recent weeks as big resistance. A break below $14 would signal a bearish breakdown and could send the pair lower to $13 or even $14.
LINK chart TW link: https://www.tradingview.com/x/J5mHBk9j/
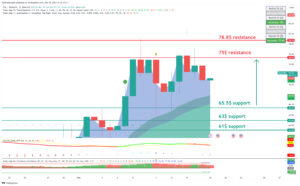
SOL:
INTRO: SOL is ready to break the 75$ resistance with a strong buy push.
Here is a technical analysis of the SOL/USDT chart:
Key Levels:
• Resistance: $75, $78.8
• Support: $65.5, $63
Strategy:
• Long: Buy at $65.5 with a stop loss below $61 and a target price of $75.
• Short: Sell at $75 with a stop loss above $78.8 and a target price of $65.5.
Range Description:
SOL/USDT is currently trading in a range between 65$ and 75.5$. However, there are signs that the pair is ready to make a move to push strong resistance at 75$.
On the upside, SOL/USDT is facing resistance at $75. This level has been tested today and if the price holds above on the daily close it will be confirmed as support. A break above $75 would signal a bullish breakout and could send the pair higher to $78.8.
On the downside, SOL/USDT is facing support at $65.5. This level is a previous swing low and has been tested multiple times in recent weeks as big support. A break below $65.5 would signal a bearish breakdown and could send the pair lower to $62 or even $58.
SOL chart TW link: https: https://www.tradingview.com/x/fMoJ4E8d/
SOL 1D Chart:
CRYPTO NEWS:
CRYPTO’S HOTTEST NARRATIVES AND TOKENS
New narratives are a lot like pimples… they’re always popping up out of nowhere.
And right now, crypto looks like a 6th grader nicknamed “Pimple Pete” – the narratives are everywhere.
Real World Assets (RWAs). Decentralized Physical Infrastructure (DePIN). Gamble-Fi. You name it.
Well, check it out…we recently came across this Dune dashboard showing how each of crypto’s narratives has performed this month:
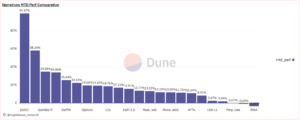
A few things stick out:
1/ DeSci is the best-performing narrative so far this month.
My researchers tell me there are very few DeSci tokens right now so the data might be skewed a bit, but either way, this might be a good early opportunity.
2/ Memecoins continue to dominate.
$BONK (the “dog” coin of Solana) is up 100x over the last 55 days and is close to entering the top 50 cryptocurrencies by market cap.
P.S. – the new trend is to find the “Dogecoin of [enter blockchain name]”.
3/ Game-Fi is starting to heat up.
Although Game-Fi is lagging behind some of the other narratives, we’re seeing an increase in chatter around Web3 gaming ecosystems.
Beam (+65%), Avalanche (+50%), and a few other gaming projects are up BIG this week.
4/ Real World Assets (RWA’s) are in the red this month.
This was pretty surprising. Over the last few months, there’s been a lot of talk about “tokenizing this” and “tokenizing that”, but it looks like RWA’s have started to cool off a bit.
So, either:
1. It was just a buzzword and is now extinct, or
2. Money is just being rotated into other shiny narratives.
We’re thinking it’s the latter and money could eventually flow back into RWA’s. Who knows. But it’s a trend worth keeping an eye on.
FAST NEWS:
• Solana developers received a $300 BONK airdrop last Christmas… today, it’s worth $500,000. There’s nothing better than a white Green Christmas ?.
• Ultra debuted the first PC game that can be resold through a tokenized license. The video game marketplace is launching the game on Steam, but it will not include any in-game crypto or NFT elements.
• JPMorgan feels that ETH will outperform BTC in 2024. Stating that Ethereum’s next upgrade planned for early next year will improve the network’s bandwidth and drive more demand.
• The U.S. DOJ charged two people for operating a crypto Ponzi scheme. Committing crimes under the aliases’ of Bitcoin Yoda, Blue Wizard, and David Gabe.
Final words:
The market facing resistance and now needs to hold support for a bigger push-up.
We celebrate 1 year of blog posting by Top Trader Jake we are happy to announce that we have upgraded the BLOG post with more information and trading setups!
Please send us a message about what coin would you like to see in Trader Jake Technical Analysis we are ready to add more coins and setups.
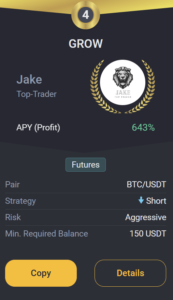
GROW BOT UPDATE:
Copy trade GROW 0.1->10k$ since 18.03 we got +176.0% PROFIT!
GROW CURRENTLY:
TRADING COIN: BTC/USDT
SETUP: SHORT
TAKE PROFIT: 41,000 USDT
SAFETY ORDERS: 1/10
Liquidation: 87,000 USDT
Not Financial Advice!
Good luck with trades,
JAKE